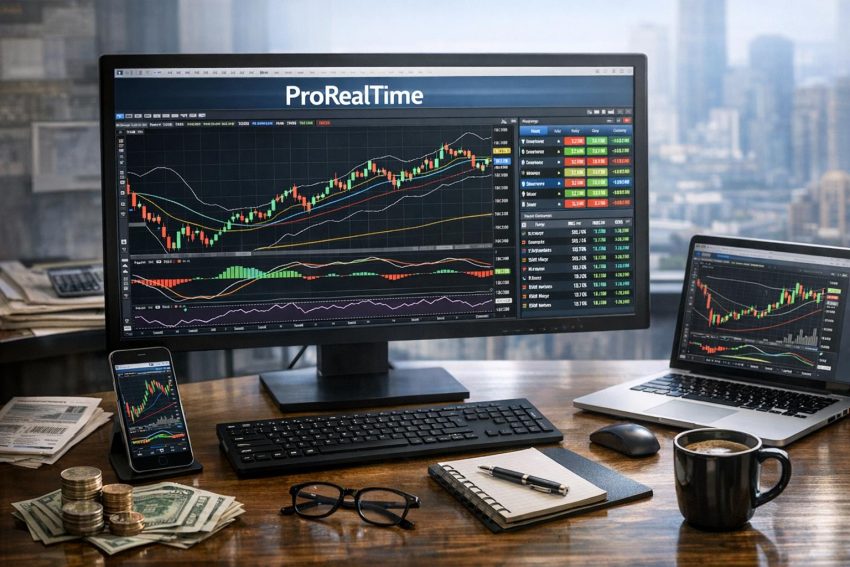
ProRealTime is an online trading and technical analysis platform for users who want to study financial markets, build rule-based strategies and, where supported, send orders through an integrated broker. It is best known for advanced charting, programmable indicators, market screening, backtesting and automated execution. Private traders, active investors and professional users can use the platform, though market access, data feeds, pricing and broker connections vary by country and account classification.
The service combines several stages of the trading process within one interface. A trader can identify instruments with a scanner, review them on charts, test a set of historical rules and submit an order through a connected brokerage account. That integration can make research more orderly, but it does not remove execution risk, market risk or the need to verify every trading assumption.
What is ProRealTime?
ProRealTime provides analytical tools for shares, stock indices, foreign exchange pairs, commodities, exchange-traded funds, futures and contracts for difference. Access depends on the selected data feed and broker. A user may have access to cash equities and futures through one arrangement, while another account may focus on leveraged derivatives.
The platform centres on technical analysis. Users can display historical and live prices, apply mathematical indicators, draw support and resistance levels, set alerts and organise several markets within a reusable workspace. Charts may be viewed independently or linked so that changing the instrument in one window updates related windows.
ProRealTime can also be used without live order placement. Some users employ it as a standalone charting and research service, then trade through another provider. Others connect it directly to a supported broker. In the latter case, the broker normally operates the account, holds client funds or assets where applicable, provides execution and sets the contractual terms for each product.
This distinction matters when assessing charges and legal protections. ProRealTime supplies software and related services, but the connected broker may determine margin requirements, order handling, financing rates, available products and account eligibility. Users should review both sets of documentation rather than assuming that every feature comes from one company.
Who may find ProRealTime useful?
ProRealTime generally suits traders who rely on charts, technical rules or repeated research procedures. An active share trader may use ProScreener to identify stocks meeting a set of price and volume conditions. A futures trader may build intraday charts with volatility indicators and order-entry controls. A systematic trader may write, test and automate rules through the platform’s programming tools.
Long-term investors can also use ProRealTime, especially if they monitor technical entry levels or maintain broad watchlists. Still, someone who buys a small number of shares a few times per year may find a standard broker interface sufficient. Advanced scanners and automation provide little benefit if they are rarely used.
The platform may appeal less to investors whose process depends mainly on company accounts, valuation models, analyst research and portfolio fundamentals. ProRealTime is strongly oriented toward price-based analysis. Technical studies can support a broader research method, but they do not replace balance sheets, cash-flow statements, economic data or product knowledge.
Charting and workspace features
Charting is one of ProRealTime’s main functions. Users can select candlestick, bar, line and other display formats, depending on the version and market. Time intervals range from short intraday periods to daily, weekly and monthly charts. Tick-based and other specialised views may also be available under some data arrangements.
A common setup uses several timeframes for the same instrument. A trader might keep a weekly chart open to review the primary trend, a daily chart for price structure and a shorter chart for order timing. Linked windows reduce the need to enter the same symbol repeatedly. Selecting a market in a watchlist can update all linked charts at once.
Workspaces can hold charts, lists, scanners and order panels. Saved layouts help users maintain a repeatable research routine. One workspace might focus on European shares, while another holds futures charts and intraday indicators. This separation is useful because overcrowded screens tend to produce more distraction than insight.
Charts can show historical and streaming prices according to the user’s data subscription. Delayed prices may be adequate for end-of-day study but are generally unsuitable for short-term order decisions. A delay of several minutes can materially change the apparent entry price, spread or position risk.
Drawing and annotation tools
ProRealTime includes drawing tools for trend lines, horizontal levels, channels, price ranges and Fibonacci measurements. Text notes and markers can be added directly to charts. These tools allow traders to record prior highs, gap areas, stop zones and planned entry levels without maintaining a separate document.
Drawings remain subjective. Two traders may place a trend line differently even when viewing the same chart. It helps to define a repeatable method, such as requiring several price contacts or using closing prices rather than intraday extremes. Consistency makes later review more useful.
Charts should not become covered with every available drawing and indicator. Too many overlays can hide the underlying price action. A plain chart with a few well-defined measurements often provides more usable information than a screen packed with coloured lines. There is a point where analysis turns into interior decoration.
Technical indicators in ProRealTime
The standard indicator library includes moving averages, relative strength index, moving average convergence divergence, stochastic oscillators, Bollinger Bands and average true range. Users can also study volume, volatility, momentum and trend behaviour through related calculations.
Most indicators allow parameter changes. A moving average can use a different lookback period or calculation method, while an oscillator can use revised threshold values. Changes should have a reason behind them. Repeatedly adjusting settings until a chart looks profitable creates weak evidence because the parameters may be fitted to past prices.
Indicators derive their values from market data, so they do not possess independent knowledge of future events. A moving average responds to prices that have already traded. A momentum oscillator summarises recent movement. These tools can describe behaviour and impose consistent rules, but they cannot predict earnings surprises, policy announcements or sudden liquidity changes with certainty.
Indicator combinations also require care. Several trend indicators may appear to confirm one another while measuring nearly the same price behaviour. The trader then sees multiple signals but only one underlying idea. Combining a trend measure with volume, volatility or market structure may provide a broader view, though no combination removes uncertainty.
Custom indicators with ProBuilder
ProBuilder is the programming environment used to create custom indicators in ProRealTime. Its language is designed around trading calculations and is generally easier to read than many general-purpose programming languages. Users can define variables, refer to historical bars, apply conditions and display calculated values on a chart.
A basic script might calculate the difference between two moving averages and display a marker when the shorter average crosses the longer one. A more developed indicator could combine trend direction, trading volume, volatility and time filters. It might colour price bars or produce an alert only when all programmed conditions are true.
Basic programming knowledge remains necessary. Users need to know how the platform refers to prior bars, how it treats missing data and when a condition is evaluated. A small error can change a result without producing an obvious warning. Using the wrong comparison operator or bar reference may create signals that look reasonable but do not follow the intended rule.
Custom code should be tested on several instruments and time intervals before it is trusted. Manual spot checks are useful: compare a few signals against calculations made separately or inspect the relevant bars one at a time. This is not glamorous work, but it catches mistakes that a polished chart may hide.
Using third-party code
Users can find ProRealTime scripts in forums, educational material and commercial libraries. Code from another person should be treated as an unverified research input. Its author may have used different market data, trading hours, assumptions or platform settings.
A trader should read the logic, test the calculations and check whether the script changes past signals after later data becomes available. Such behaviour, often called repainting, can make an indicator look accurate in hindsight even though its earlier signal was not stable at the time.
Commercial scripts also require a sensible review. A high price does not prove that a program has predictive value. Buyers should examine what the code measures, whether the rules are visible, how performance claims were calculated and whether realistic costs were included.
Market screening with ProScreener
ProScreener searches groups of instruments for user-defined conditions. Scans may look for price movements, volume changes, indicator readings, recent highs or lows, trend conditions and technical patterns. The available markets depend on the data package and the lists supported by the platform.
As an example, a share trader could search for stocks trading above a long-term moving average while daily volume exceeds its recent average. Another scan could identify instruments whose relative strength index has crossed a chosen threshold. Results can then be sorted by return, volume, volatility or another calculated value.
Screening saves time when a trader follows hundreds or thousands of instruments. It replaces repetitive chart checking with a consistent set of rules. The output is a research shortlist, not a trade recommendation. A result may have poor liquidity, a wide spread or an imminent company announcement that the technical conditions do not reflect.
The selected screening universe also affects results. A scan of current index members can introduce survivorship bias into historical research because failed or removed companies may be absent. Traders working with equities should check corporate actions, exchange listings and liquidity before relying on a scanner result.
Building a practical screening process
A useful scan usually starts with a clear market idea. The user defines what behaviour is being tested and why it may matter. Conditions can then be kept relatively simple. Adding many filters may reduce the number of results, but it can also produce a fragile rule that works only in a narrow sample.
After running a scan, traders can review chart structure, spread, average turnover and upcoming announcements. They may then add suitable instruments to a watchlist rather than placing orders immediately. This brief review helps separate a valid formula match from a practical trading candidate.
Backtesting strategies with ProBacktest
ProBacktest evaluates rule-based trading systems against historical market data. Users define entry conditions, exit rules, stops, position sizing and related instructions. The program applies those rules to the selected period and reports the resulting trades and performance statistics.
A backtest can help answer questions that are hard to judge from charts alone. It can show how often a setup occurred, how long positions remained open, whether losses were concentrated in one period and how the strategy behaved during falling or rising markets.
Common statistics include net gain or loss, number of trades, winning-trade percentage, average trade, maximum drawdown and market exposure. No single measure gives a complete assessment. A high winning percentage can still produce a losing system if the average loss is much larger than the average gain. Strong net profit may also conceal a drawdown that exceeds the user’s practical risk tolerance.
| Backtest measure | What it describes | Common interpretation issue |
|---|---|---|
| Net result | Total simulated gain or loss | May look favourable if costs are omitted |
| Maximum drawdown | Largest decline from a prior equity peak | Future drawdowns may be larger |
| Win rate | Share of closed trades that made money | Does not show the size of gains and losses |
| Average trade | Mean result across all simulated trades | Small values can disappear after slippage |
| Exposure | Time or capital committed to the market | High exposure may increase event risk |
Transaction costs and execution assumptions
Historical results should include commissions, spreads, financing charges and plausible slippage. Their effect is greater in systems that trade frequently or target small price movements. A method showing a tiny average profit per trade may become unprofitable after ordinary execution costs.
Bar-based tests can also create uncertainty about the order of intrabar prices. If both a stop and profit target fall within the same bar, the program may need an assumption about which level traded first. Higher-resolution data can reduce this issue, though it cannot recreate every feature of the live order book.
Market orders cannot always execute at the last displayed price. During gaps or fast movement, the next available price may be materially worse. Thinly traded shares and contracts are particularly prone to slippage. Backtests based on clean chart prices may therefore present an optimistic result.
Overfitting and out-of-sample testing
Overfitting occurs when rules are adjusted repeatedly to match past data. The finished strategy may describe historical noise rather than a durable market relationship. Warning signs include many parameters, unusually precise thresholds and strong results confined to one instrument or short period.
One method of reducing this risk is to divide the data. A development sample is used to form the rules, while a separate out-of-sample period is reserved for later testing. The trader can also test the strategy on related instruments and through different volatility conditions.
Parameter stability matters as well. If a strategy performs acceptably across a range of nearby settings, its logic may be more dependable than a strategy that works only with one exact value. This does not prove future profitability, but it provides a better test than selecting the best result from thousands of combinations.
Automated trading with ProOrder
ProOrder is the automated trading component associated with ProRealTime. Subject to broker support, account permissions and product availability, a programmed system can monitor conditions and manage orders without constant manual input.
Automation can apply the same instructions repeatedly. It may open a position, place protective orders and close the trade when an exit condition occurs. This approach can reduce hesitation and manual order-entry mistakes. It also allows a strategy to monitor the market during its programmed operating hours.
Automation introduces operational risks. Incorrect code can submit an unwanted order or use the wrong position size. Market data can stop, an order may be rejected or a connection may fail. Rapid price movement can produce fills far from the expected level.
Users should learn how the service behaves if the local computer is switched off, the platform disconnects or the broker rejects an instruction. The answer may depend on how the current service hosts and manages automated systems. Users should confirm the current operating model in official documentation rather than relying on an old forum post.
Testing before live automation
A staged approach is generally sensible. The strategy can begin with code checks and historical testing, followed by simulated monitoring where available. A small live allocation may then reveal order and cost behaviour that historical testing did not show.
Traders should compare actual fills with expected fills. They should also monitor rejected orders, missed signals, financing charges and position reconciliation. If the automated system says a position is closed while the broker account still shows it open, the broker account is the record that needs immediate attention.
Emergency controls should be defined before activation. These may include a maximum daily loss, maximum position size, trading-hour restriction or instruction to stop after repeated order errors. Automation should not be left unchecked simply because it has performed well for several weeks.
Order types and trade management
Available order types depend on the broker, exchange and financial product. Common choices may include market, limit and stop orders, along with linked stop-loss and profit-taking instructions.
A market order requests execution at the best available price. It gives priority to execution rather than price, so the final fill can differ from the quote shown on screen. This difference tends to increase during volatile periods, at market openings and in instruments with thin order books.
A limit order sets the highest price a buyer will pay or the lowest price a seller will accept. It controls the execution boundary but does not guarantee a fill. The market can touch the limit without fully filling the order if other orders have priority or there is insufficient available volume.
A stop order becomes active after its trigger level is reached. It may be used to enter after a breakout or to exit a losing position. An ordinary stop does not guarantee the trigger price. If the market gaps, execution may occur at the next available price. Guaranteed stops may be offered for some products and usually carry conditions or extra charges.
Position sizing and margin
The order panel may show position size, margin use and estimated profit or loss. These figures should be checked before submission. A misplaced decimal point or incorrect contract quantity can create much more exposure than planned.
Margin is collateral rather than the maximum possible loss. Leveraged positions can move against the trader quickly, and the broker may close positions if account equity falls below required levels. Margin requirements may rise during volatile periods or before major events.
Position size can be based on the amount a trader is prepared to lose if the stop is reached. This requires considering the distance to the stop, contract value, currency conversion and expected slippage. Using the same number of contracts for every trade can lead to inconsistent risk because market volatility changes.
Broker integration and account structure
ProRealTime works with supported brokers, but available integrations vary by location and product. Some users receive platform access under a broker arrangement, while others purchase charting or data services separately. Account-opening rules, minimum deposits and trading permissions are set by the relevant provider.
The broker generally controls execution, order routing, margin, custody and account statements. It may also decide which ProRealTime functions are available for a product. A feature shown in platform documentation may not be active for every connected account.
Before opening an account, users should confirm the legal entity that will hold the account and the regulator responsible for it. A financial group may operate several entities under different legal and compensation arrangements. The website brand alone does not always identify the contracting company.
Users should also review client-money treatment, asset custody, complaint procedures and insolvency protections. These matters are separate from chart quality but far more relevant if a broker encounters financial trouble.
Market data and exchange fees
Market data may be live, delayed or end-of-day. The service provided can differ by exchange and account status. Many exchanges charge separate fees for live prices, and professional users may pay more than private users.
Data classification should be completed accurately. Exchanges often define professional status according to employment, registration, business use or the way data is distributed. Choosing the wrong classification can lead to revised charges or access changes.
Data quality affects charts, indicators, scans and backtests. Missing bars, incorrect corporate-action adjustments and incomplete trading sessions can alter calculations. Equity charts should account for share splits and related actions where appropriate. Futures users should know whether they are viewing an individual contract or a continuous series assembled from several expiries.
Foreign exchange and CFD prices may come from the broker rather than a central exchange. Quotes can vary between providers because the underlying market structure and pricing sources differ. A strategy tested on one provider’s data may not produce identical signals elsewhere.
Costs of using ProRealTime
The cost of ProRealTime depends on the chosen service, data feeds, broker arrangement and trading activity. Some broker-linked plans may reduce or waive a platform charge if account conditions are met. Current terms should always be checked because pricing structures can change.
Trading costs may include commissions, bid-ask spreads, exchange fees, data subscriptions, currency conversion and overnight financing. Futures positions may incur exchange and clearing charges. CFD positions can carry daily financing costs, while short equity positions may involve stock-borrow fees.
Inactivity or service charges may also apply under some arrangements. A platform advertised without a monthly fee is not necessarily free to use. The cost calculation should cover the full research and trading process, not just the visible order commission.
Frequent traders should compare costs against average strategy profit per trade. If a backtest earns a small amount before charges, even modest commissions and slippage can remove the statistical advantage. Costs are not an administrative footnote; they are part of the strategy.
Desktop, web and mobile access
ProRealTime has long been associated with a desktop application offering broad charting, scanning and programming functions. Web and mobile access may also be available, depending on the service arrangement. Features can differ between versions.
The desktop application is generally better suited to multi-chart layouts, code editing and detailed historical analysis. It can support several windows and saved workspaces, which is useful for users monitoring more than one market.
Web access offers convenience on computers where installing software is impractical. Mobile access is more appropriate for checking prices, reviewing open positions and handling basic orders. Writing code or analysing a large set of charts on a phone is possible only in the generous sense of the word possible.
Users should verify whether watchlists, chart drawings, alerts and layouts synchronise across devices. They should also secure account access with available authentication controls and avoid trading through unsecured public networks.
Alerts and monitoring
Alerts can notify users when a market reaches a price, an indicator meets a condition or another programmed event occurs. They are useful for traders who do not want to watch charts continuously.
An alert is not the same as an order. It may arrive after the market has moved beyond the trigger, depending on data delivery, device settings and communication delays. Users should also confirm whether an alert remains active after it fires and whether it is stored on the service or relies on a running application.
Alert rules should be tested much like trading code. A condition based on a closing price may behave differently from one evaluated during an unfinished bar. Traders need to know whether they want immediate notification or confirmation at the end of the selected interval.
Learning ProRealTime efficiently
New users usually benefit from learning the platform in stages. Basic chart controls, watchlists and order settings should come before programming and automation. Once those functions are familiar, the user can move to custom indicators, scanning and historical strategy tests.
Changing one variable at a time makes results easier to interpret. If a trader changes the indicator, timeframe, stop and position size together, there is no clear way to identify which change affected performance.
A research log can record rule definitions, data periods, parameter changes and test results. It also helps prevent accidental hindsight. Without written records, it is easy to forget failed versions and remember only the one that happened to work.
ProRealTime documentation and code examples can explain syntax and platform behaviour. Broker training material may cover order entry and account functions. Community discussions can offer useful ideas, but any claim should be checked against current software behaviour and independent testing.
Advantages of ProRealTime
ProRealTime brings charting, custom indicators, screening, backtesting and supported broker execution into one interface. This can reduce manual transfers between separate research and trading applications.
The programming language gives technically minded users more control than a basic broker chart package. Saved code and workspaces can support repeatable analysis, while ProScreener can process broad instrument lists quickly.
Backtesting tools help users assess rule behaviour across historical data rather than relying on a few memorable chart examples. ProOrder may suit traders who have a tested rule set and want consistent execution.
The platform is also flexible enough to serve different trading horizons. An end-of-day share trader and an intraday futures trader can both use it, though their data, execution and workspace needs will differ.
Disadvantages and practical restrictions
The range of functions creates a learning curve. Basic charting is relatively straightforward, but reliable coding and backtesting require patience. Users who skip the learning stage may misread results or automate an error.
Availability and pricing vary by broker, market and country. Not every account receives the same data, order types or automation features. This variation can make comparisons harder because two users may describe different service arrangements under the same platform name.
Historical tests can create false confidence if costs, slippage and data issues are ignored. Programming also encourages users to test many rule combinations, raising the risk of overfitting.
ProRealTime is heavily focused on technical analysis. Investors who need detailed fundamental screening, company filings or portfolio tax tools may need separate research services. Mobile interfaces may also be less suitable for code development and multi-chart analysis.
Risk and regulatory considerations
Trading shares, futures, foreign exchange and contracts for difference can result in financial loss. Leverage increases exposure relative to deposited capital and can produce rapid losses. Stops may reduce risk but do not guarantee an execution price unless the broker explicitly offers a guaranteed-stop arrangement.
Technical indicators cannot forecast prices reliably in every condition. Signals may fail during earnings releases, economic announcements, exchange interruptions or abrupt changes in liquidity. Automated systems can repeat an error much faster than a person placing orders manually.
Prospective users should read the broker’s legal terms, risk warnings and product documents. They should verify the regulated entity, client-money rules, applicable compensation arrangements and complaint process. Tax treatment should also be checked under the user’s local rules.
Risk controls may include position-size caps, maximum account exposure, daily loss thresholds and restrictions around scheduled announcements. These controls should reflect the product, account size and trader’s financial position. Platform functionality should never be mistaken for proof that a trade is suitable.
Is ProRealTime suitable for your trading method?
ProRealTime is most relevant to users who value advanced charts, programmable rules and structured market screening. It may also suit traders who want research and supported broker execution in the same application.
Before choosing it, users should compare the required markets, live-data fees, broker charges, device support and automation terms. They should confirm that the desired instruments and order types are available in their country and account category.
A trial, demonstration account or low-risk testing period can help assess the interface and workflow. During that period, users can check chart speed, data quality, scanner behaviour and the practical process of placing and amending orders.
ProRealTime should be viewed as a research, testing and execution platform rather than a provider of guaranteed signals. Its usefulness depends on sound data, sensible assumptions, accurate programming and disciplined risk control. Current pricing, integrations and feature availability can change, so users should consult recent ProRealTime and broker documentation before opening or funding an account.