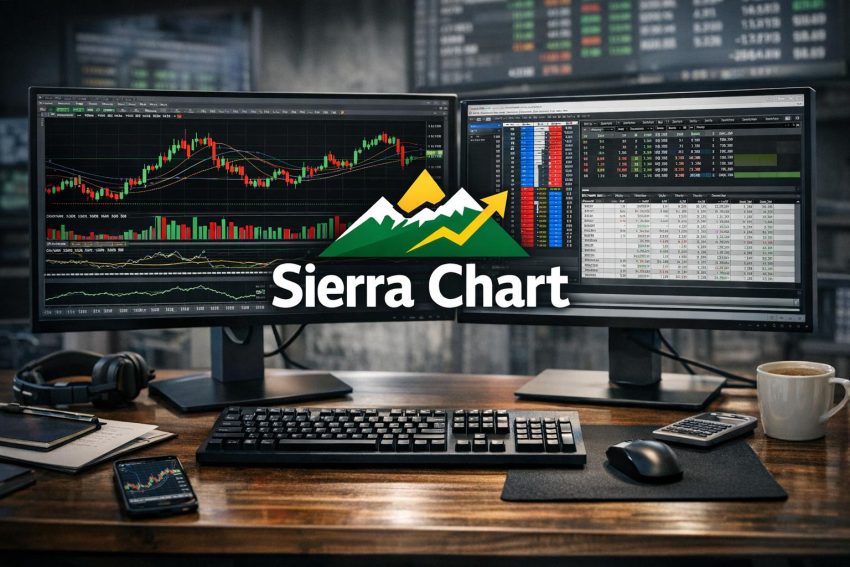
Sierra Chart is a Windows desktop platform for charting, market analysis, order entry, trade simulation, and automated strategy development. It is widely associated with futures trading, though supported data and brokerage connections may also provide equities, foreign exchange, indexes, options on futures, and cryptocurrency instruments.
The platform places detailed configuration ahead of convenience. Users control chart construction, session times, data storage, study calculations, market-depth displays, and order-entry behavior. That degree of control appeals to active traders who want to know how their charts are built rather than accept preset layouts with few adjustable settings.
Sierra Chart is particularly well known for volume profiles, Numbers Bars, historical market depth, time and sales, and exchange-derived bid-and-ask data. It also supports conventional technical indicators, drawing tools, alerts, spreadsheets, custom C++ studies, and direct chart trading. These functions can operate within one installation, but each still depends on correct symbols, reliable data, and appropriate exchange permissions.
The desktop design has practical consequences. Market data and chart files are commonly stored on the local computer, giving the user direct control over records and workspaces. On the other hand, installation, updates, backups, file maintenance, and computer performance become the user’s responsibility. Traders accustomed to opening a browser and signing in may find the initial setup rather plain and somewhat unforgiving.
How Sierra Chart Is Organized
Sierra Chart separates its functions into chartbooks, individual charts, studies, data files, global settings, symbol settings, and trading connections. Learning how those parts interact is one of the first tasks for a new user.
A chartbook is a saved group of charts and associated settings. One chartbook might contain several E-mini S&P 500 charts, while another might contain crude oil or Treasury futures. Traders can arrange chartbooks by market, strategy, session, account, or research task. Keeping unrelated work in separate chartbooks often makes maintenance easier.
Each chart has its own symbol, bar period, session schedule, scale, graphics settings, and studies. A chart may use one-minute bars, 2,000-volume bars, range bars, or another supported construction method. Studies then calculate values from that chart’s records or from referenced studies and charts.
Global settings apply more broadly. They cover matters such as data-service selection, keyboard shortcuts, trade configuration, graphics defaults, sound alerts, and program behavior. Symbol settings define tick size, price display format, contract value, exchange identifiers, and related properties. Errors in either area can affect every chart using the relevant symbol, so casual changes are best avoided.
Local Files and Data Storage
The program commonly writes historical intraday records to local data files. After data has been downloaded, Sierra Chart can use those files to rebuild charts without requesting the entire history again. This approach can reduce repeated downloads and gives users access to previously stored sessions even when a connection is temporarily unavailable.
Local storage also creates housekeeping duties. High-volume contracts, tick-by-tick records, and historical depth files can consume substantial disk space. Old contracts may remain on the computer long after they are no longer actively traded. Periodic review helps prevent a trading machine from turning into an accidental archive server.
Chartbooks, study collections, custom code, trade configuration files, and program settings should be backed up. Copying only screenshots does not preserve the setup. A useful backup contains the actual chartbook and configuration files, preferably stored outside the main Sierra Chart directory and on another drive or secure storage device.
Separate Data and Trading Connections
Market data and order routing are related, but they are not always supplied by the same service. A user may receive exchange data through one supported connection while sending orders through a broker-linked service. In other arrangements, one connection handles both tasks.
This separation explains why a chart can update correctly while order routing remains unavailable, or why an account connection can work while real-time exchange prices remain delayed. Subscription status, exchange agreements, symbol mappings, broker permissions, and account credentials must all match the intended setup.
Sierra Chart itself is not a broker, futures commission merchant, clearing firm, or securities exchange. It processes data and trading messages provided by connected firms. Account custody, margin, clearing, regulatory reporting, and many risk controls remain with the broker or clearing provider.
Chart Construction and Price Displays
Sierra Chart supports ordinary candlestick, OHLC bar, line, mountain, and close-only charts. It also provides non-time-based formats such as volume bars, number-of-trades bars, range bars, reversal bars, Renko-style displays, point-and-figure charts, and other price-driven constructions.
Time bars group transactions into fixed intervals. A five-minute chart closes each bar after five minutes, regardless of whether the period contains heavy activity or very few trades. Volume bars close after a defined amount of volume has traded. Range bars use price movement, while number-of-trades bars count recorded transactions.
These construction methods answer different analytical questions. Time bars preserve the pace of the session. Volume and trade-count bars place more visual space around active periods and compress quieter periods. Range-based formats reduce the direct role of elapsed time. None is automatically more accurate; each reorganizes the same market activity according to a chosen rule.
Session Times and Trading-Day Definitions
Session configuration has a major effect on intraday studies. Futures contracts may trade for much of the day, but traders often separate the main daytime session from overnight activity. Sierra Chart permits primary and evening session definitions, allowing charts and studies to include or exclude selected periods.
A volume profile based on the full electronic session will differ from one based only on regular trading hours. Daily highs, lows, opening ranges, VWAP calculations, and prior-session references may also change. Two traders can use the same contract and data feed yet see different values because their session templates do not match.
Time-zone settings deserve similar care. Chart time, computer time, and exchange time can differ. Around daylight-saving changes, an unnoticed time-zone error may shift session boundaries or produce bars that do not line up with another platform. Verifying a chart against published exchange hours is a sensible early check.
Continuous Futures Contracts
Futures contracts expire, so long-term analysis often requires a continuous contract series. Sierra Chart offers methods for joining individual contracts and adjusting earlier prices. A back-adjusted series may remove price gaps caused by contract rollover, while an unadjusted series preserves the traded prices of each contract.
The choice depends on the task. Back adjustment can make long-term trend studies easier to read, but it changes historical price levels. Unadjusted data retains actual prices, though rollover gaps can distort indicators. Order-flow work normally focuses on the active contract because volume at a historical price belongs to the contract that actually traded there.
Rollover settings also affect live charts. Moving too early can place the trader in a thin contract; moving too late can leave the chart attached to declining volume. Comparing volume and open interest between the expiring and next contract provides a more defensible basis than using a calendar date alone.
Appearance, Scales, and Chart Linking
Users can control bar colors, backgrounds, grid lines, fonts, value labels, price scales, and chart regions. Studies may appear over price or within separate panels. Independent scales allow indicators with unrelated values to share a chart without compressing the main price graph.
Charts can be linked by symbol, session times, scroll position, or other settings. A trader might link a daily chart, a 30-minute chart, and a short-term execution chart so that changing the contract updates all three. Drawing synchronization can also carry marked levels between linked charts.
Linking saves time, though a careless link can overwrite settings that were meant to stay separate. It is worth checking the assigned link number and selected linkage options before applying changes across a large chartbook.
Technical Studies and Drawing Tools
Sierra Chart includes a broad collection of technical studies. Common choices include moving averages, Bollinger Bands, Average True Range, MACD, stochastic oscillators, RSI, VWAP, pivot calculations, regression studies, cumulative indicators, and volume-based measures.
A study can accept inputs from the main chart, another study on the same chart, or a referenced chart. This allows one calculation to feed another. A moving average could use an oscillator rather than price, or a lower-time-frame chart could reference a value calculated on a daily chart.
Study settings cover input values, calculation order, line style, colors, labels, alerts, and subgraphs. Many studies expose more controls than their equivalents on simpler platforms. That flexibility is useful, but changing an unfamiliar input without checking its effect can produce an attractive yet invalid display.
Study Collections
A study collection saves a group of indicators and their settings for reuse. A trader can create one collection for trend analysis, another for order flow, and another for execution. Applying a saved collection is faster and less error-prone than rebuilding the same stack manually.
Collections should still be reviewed after application. A study that references Chart 3 in one chartbook may point to unrelated data in another. Session-based calculations may also behave differently after being moved to a chart with another trading-day definition.
Drawing and Annotation
Drawing tools include horizontal and vertical lines, rays, extended lines, channels, rectangles, text labels, Fibonacci retracements, projections, markers, and measurement tools. Users can associate drawings with a chart, copy them, or share them with linked charts.
Practical uses include marking prior highs and lows, settlement prices, overnight ranges, opening levels, and areas where earlier volume concentrated. The tools also support post-trade review. A trader can mark an entry, stop, target, and alternative decision point directly on the historical chart.
Too many drawings can obscure the price record. A workable convention is to use consistent colors and line styles for different classes of levels. If every line is bright red and three pixels wide, the chart soon resembles a road map drawn during an argument.
Volume Profiles and Volume-at-Price Analysis
Volume-at-price analysis distributes traded volume across price levels rather than displaying only total volume per bar. Sierra Chart can calculate profiles for sessions, fixed periods, visible chart ranges, repeating intervals, or manually selected sections.
A profile commonly displays the point of control, which is the price with the highest recorded volume in the chosen period. It may also show a value area containing a chosen percentage of volume. High-volume nodes represent prices where more business occurred, while low-volume nodes show prices with less recorded activity.
These labels describe historical trading, not guaranteed support or resistance. A high-volume node can attract later trade because participants previously accepted that area, but price can also pass through it without pausing. Context, current liquidity, volatility, and news conditions still matter.
Profile Period and Calculation Choices
The profile period changes the meaning of the display. A daily profile describes one session, while a weekly profile combines several sessions. A profile drawn over a manually selected swing answers a different question from a rolling profile based on the visible chart.
Users can configure row height, value-area percentage, profile width, labels, coloring, and whether bid-and-ask data is shown. Profiles may appear beside each period or overlap price bars. Sierra Chart also supports developing profile values, allowing the point of control and value area to update while the session proceeds.
Historical accuracy depends on the data records. If the stored file lacks reliable volume at each price, the profile cannot recreate detail that was never received. Daily summary data is not a substitute for properly recorded intraday transactions.
VWAP and Related Bands
Volume Weighted Average Price combines traded price and volume over a chosen period. Sierra Chart can calculate session VWAP, rolling VWAP, and anchored forms depending on the study and configuration. Bands may be plotted around VWAP using standard-deviation or fixed-offset methods.
VWAP values depend on session boundaries and available volume data. A full-session VWAP will not match a regular-hours VWAP. Cryptocurrency and spot foreign exchange data may also use provider-dependent volume measures rather than centralized exchange volume, so the meaning of the calculation can differ by market.
Numbers Bars and Footprint Charts
Sierra Chart refers to its footprint-style display as Numbers Bars. The study prints trade information at individual prices within each bar. Common formats include bid volume, ask volume, total volume, delta, and calculated percentage comparisons.
Bid volume usually represents trades classified as occurring at the bid, while ask volume represents trades classified as occurring at the ask. The classification relies on feed records and platform processing. It does not reveal the identity or motive of either party.
A market buy executes against a resting offer, and a market sell executes against a resting bid. Footprint traders therefore use ask volume as a measure of aggressive buying and bid volume as a measure of aggressive selling. The wording can be misleading at first because every completed trade still has both a buyer and a seller.
Delta and Cumulative Delta
Delta is commonly calculated as ask volume minus bid volume. Positive delta means more volume was recorded at the ask; negative delta means more was recorded at the bid. Sierra Chart can display delta by price, by bar, across a session, or as a cumulative series.
Delta does not predict direction on its own. Price can rise with negative delta or fall with positive delta. Such behavior may reflect absorption, changes in available liquidity, trade classification, or activity occurring outside the observed period. A delta reading has greater analytical value when compared with price location and prior structure.
Cumulative delta adds bar delta over time. The starting point affects the resulting line, so users should define whether the calculation resets each session or continues across sessions. Comparisons between platforms are unreliable unless both use comparable data, session rules, and reset settings.
Bid-and-Ask Imbalances
Numbers Bars can highlight imbalances between bid and ask volume. A diagonal comparison commonly compares ask volume at one price with bid volume one tick below. This reflects the prices at which aggressive buyers and sellers compete across the spread.
Thresholds may be expressed as ratios or percentages. A trader might highlight an ask value that is several times larger than the diagonally related bid value. Stacked imbalances refer to several adjacent highlighted prices, but the exact definition comes from user settings rather than a universal market rule.
Very low comparison values can create exaggerated ratios. Comparing 30 contracts with one contract produces a large percentage, though neither value may matter in an active futures contract. Minimum-volume filters can reduce this problem.
Interpreting Footprint Data
Footprint charts add transaction detail, but more printed numbers do not automatically lead to better decisions. Traders commonly examine activity near prior highs, lows, profile boundaries, opening ranges, or other defined locations. Reading every imbalance in the middle of a routine range tends to produce noise.
Data quality is central. Aggregated feeds, missing records, incorrect tick settings, and reconstructed history can change bid-and-ask totals. Before relying on a footprint template, users should compare live values with time and sales and confirm that historical downloads contain the required fields.
Market Depth and Historical Order-Book Data
Market depth displays resting buy and sell orders at available price levels. Sierra Chart can present this through a trading ladder, depth windows, chart columns, and the Market Depth Historical Graph study.
The historical graph records how displayed depth changed over time and plots those values behind or beside price. Colors can represent relative order size, allowing the user to review where liquidity appeared, moved, or disappeared as the market traded.
This data can help with execution analysis. A trader may review whether price slowed near a large resting order, whether liquidity pulled before a move, or whether an apparent wall repeatedly refreshed. Such observations describe order-book behavior; they do not prove who placed the orders or why.
Pulling, Stacking, and Replenishment
Stacking generally describes an increase in displayed depth at a price, while pulling describes a decrease. Sierra Chart can calculate changes in depth and present them in ladder columns or studies.
Depth changes require careful interpretation. An order can be canceled because a participant changed a quote, managed inventory, reacted to correlated markets, or moved to another price. Replenishment may indicate an iceberg-style execution process, but ordinary order replacement can look similar.
Displayed liquidity is also incomplete. Hidden orders, reserve quantities, implied orders, and venue rules affect what appears. Fast markets can change faster than a human can read each update. Market depth works best as one input within an established method rather than as a standalone signal.
Feed and Exchange Dependencies
Not every market offers the same depth structure. Centralized futures exchanges provide an order book for listed contracts, subject to the subscribed depth level. Spot foreign exchange is decentralized, so a provider’s book represents only its own sources. Cryptocurrency depth varies by exchange and trading pair.
Historical depth must be recorded or downloaded in a supported form. Standard historical trade data cannot reproduce past resting orders. Users who intend to replay the order book should verify storage settings before the session they want to study.
Market Data Services and Exchange Permissions
Sierra Chart supports multiple data and trading connections, and available choices can change over time. The selected service determines which symbols are available, how history is delivered, whether market depth is included, and whether the connection supports live order routing.
Software access fees, market-data fees, and brokerage costs are commonly separate. Futures exchanges often classify subscribers as professional or nonprofessional, with different fee schedules. Some lower exchange rates require a funded brokerage account and periodic verification.
A software package should not be assumed to include real-time data from every exchange. A user interested in CME Group futures may need exchange permissions apart from Sierra Chart access. Other exchanges, indexes, and security types can require their own agreements.
Real-Time, Delayed, and Historical Data
Real-time data arrives with minimal intentional delay, subject to network and processing time. Delayed data is held back according to exchange policy. Historical data fills earlier periods and may come from the same service or a separate historical source.
A chart may combine stored history with live updates. At the joining point, differences in source or record detail can appear. Reloading and recalculating the chart can resolve ordinary gaps, though persistent discrepancies may require a data re-download or symbol review.
Historical records can also vary in granularity. Tick-by-tick data preserves each reported transaction, while aggregated records combine activity. Short-term order-flow studies generally benefit from finer records because aggregation can alter sequencing and bid-and-ask classification.
Symbol Mapping and Contract Identification
Each service may use its own symbol format. The same futures contract can have different identifiers across charting feeds and broker connections. Sierra Chart’s symbol settings and translation rules help map these identifiers, but users must select the contract accepted by the active service.
Entering an order through an incorrectly mapped symbol can cause rejection or route to an unintended contract. The contract month, exchange, currency, multiplier, and tick size should be checked before live use. This matters especially during roll periods and when mini and micro contracts share similar names.
Manual Trading and Order Management
Sierra Chart supports trading from charts, the Trade Window, trading ladders, and supported keyboard commands. Available order types depend on the connected service and exchange. Common choices include market, limit, stop, and stop-limit orders.
Chart trading displays working orders against price. Users can drag eligible orders to new levels, cancel them from the chart, and view position or profit-and-loss information. The trading ladder provides a price-centered interface with bid, ask, depth, recent volume, and order-entry columns.
Fast order entry requires disciplined configuration. A single-click ladder can send an order immediately, which is useful for speed but leaves little room to catch a quantity error. Simulation should be used until order buttons, quantity controls, cancellation commands, and flatten functions behave as expected.
Attached Orders and Brackets
Attached orders can create profit targets and protective stops after an entry order is submitted or filled. Multiple targets may divide a position into portions. Stop orders can also be configured to move to break-even or trail according to defined rules.
Whether attached orders reside on the local computer, at the broker service, or at the exchange depends on the connection and order type. Locally managed orders may require Sierra Chart and the internet connection to remain active. Server-held orders can remain active after a local outage, though their exact handling follows the provider’s rules.
Users should verify order status through the broker if the platform disconnects during an open position. Repeatedly pressing cancel or flatten without current status can create duplicate instructions when the connection returns.
Risk Controls
Sierra Chart includes controls for trade quantity, allowed position size, daily loss thresholds, and related restrictions. Broker-side and clearing-side controls may apply separately. Local controls can reduce accidental order entry, but they cannot replace account-level supervision.
Risk settings should be tested under simulation and then verified with small live quantities if live trading is appropriate. Tick value, contract multiplier, currency conversion, and stop distance all affect monetary exposure. A ten-tick stop in one contract may carry a very different value from ten ticks in another.
Simulation and Market Replay
Simulation lets users practice order entry and evaluate platform settings without routing orders to a live account. It is useful for learning ladder behavior, bracket orders, keyboard commands, chart trading, and trade-log review.
Simulated fills rely on programmed assumptions. They cannot reproduce queue position, every latency event, hidden liquidity, or the pressure associated with real financial exposure. Limit orders may fill more readily in simulation than they would in an active live queue.
Market Replay processes historical records as though the session were occurring again. Users can control speed, pause the replay, move to another point, and trade through the simulated service. This supports structured review of openings, scheduled announcements, trend sessions, and range-bound periods.
Replay Data Requirements
A price replay needs intraday trade records. A depth replay also needs historical depth records. Without those order-book files, the chart may replay trades while the historical depth display remains blank or incomplete.
Replay accuracy also depends on chart synchronization. Charts using different record periods or symbols may not advance identically unless replay settings account for them. Testing a small section before beginning a long review can save a fair bit of frustration.
Backtesting Versus Visual Practice
Visual replay evaluates decisions made while watching the chart. Automated backtesting applies programmed rules to historical records. The two methods serve different purposes and should not be treated as interchangeable.
A formal test should account for commissions, exchange fees, spread, slippage, rejected orders, partial fills, and data bias. Results can change after realistic costs are added. Testing many parameter combinations also raises the risk of fitting rules to past noise rather than repeatable behavior.
Alerts, Spreadsheets, and Automated Trading
Sierra Chart alerts can monitor prices, study outputs, crossovers, volume conditions, and other chart values. Alert formulas use logical comparisons and references to study subgraphs. Notifications may include sounds, messages, chart coloring, or supported actions.
Simple alerts can identify a price crossing a line or one moving average crossing another. More advanced formulas can require several conditions to occur within the same bar. Formula references must be checked after studies are reordered because study identifiers and subgraphs can change.
Spreadsheet Studies
The platform includes spreadsheet-based studies for users who prefer formulas over C++ programming. Chart values can populate spreadsheet columns, where formulas calculate signals or trading conditions. This method supports moderately advanced logic without compiling code.
Spreadsheet systems can become hard to audit if formulas spread across many columns and rows. Clear labels, versioned copies, and written rule definitions make later review easier. A formula that works today can become a mystery six months later, especially if it was created at 2 a.m.
ACSIL and C++ Development
The Advanced Custom Study Interface and Language, known as ACSIL, allows developers to create custom studies, chart tools, and automated trading systems in C++. Code can read chart records, access study arrays, draw graphics, process order updates, and submit trading instructions.
ACSIL offers close integration with the charting engine. It suits developers who need calculations or trading behavior that standard studies and alerts cannot provide. Development still requires knowledge of C++, platform functions, order states, and event-driven program behavior.
Custom studies should be tested with historical data, replay, and simulation before live deployment. Logging helps identify repeated submissions, missed state changes, and assumptions that fail after reconnects. Automated systems also need rules for startup, shutdown, data loss, partial fills, and existing positions.
External Interfaces
Supported communication methods allow external programs to exchange data or instructions with Sierra Chart. An external application may perform analysis while Sierra Chart handles charts and execution. Every extra process creates another point where timing, permissions, or connectivity can fail.
Developers should define which application controls order state and how conflicting instructions are prevented. If both the external program and a chart study attempt to manage the same position, order behavior can become unpredictable.
Performance and Computer Requirements
Sierra Chart has a reputation for efficient processing, but performance still depends on workload. Tick charts, many open chartbooks, historical depth, high-frequency studies, and long lookback periods increase processor, memory, and disk demand.
Chart update intervals affect how often charts redraw and studies calculate. Very short intervals can make displays appear more responsive while adding computation. A setting that makes sense for an execution chart may be unnecessary for a daily chart.
Solid-state storage improves file access, especially when loading large intraday and depth records. Adequate memory helps when several contracts and long histories are open. Stable networking matters more than headline download speed because dropped packets and repeated reconnects can disrupt live monitoring.
Windows and Other Operating Systems
Sierra Chart is primarily a Windows application. Some users run it on macOS or Linux through compatibility layers, virtual machines, or remote Windows computers. Those arrangements add another software layer and may require extra work for graphics, file paths, networking, and updates.
A remote Windows server can keep charts and automated systems running away from the trader’s home connection. It also introduces remote-access security, server fees, and reliance on the hosting provider. Local and remote configurations should both include recovery procedures.
Maintenance and Updates
Updates may add studies, correct faults, change service compatibility, or modify internal behavior. Installing every release immediately is not always necessary for a stable trading setup. Many active users keep a known working installer and test a newer version before adopting it for live use.
Maintenance should include data-file review, backup checks, chartbook copies, and verification of custom studies after an update. Contract rollovers and exchange schedule changes also require attention even when the platform software has not changed.
Usability and Learning Curve
Sierra Chart does not hide much from the user. Menus contain many controls, dialog boxes expose detailed settings, and similar functions may appear at chart, study, symbol, or global level. That structure rewards careful users but can slow the first setup.
A sensible starting configuration uses one symbol, one chartbook, a few studies, and simulated trading. The user can then verify session times, real-time status, tick size, order quantity, and chart behavior before adding more charts.
Documentation plays a central role because many advanced functions cannot be inferred from menu labels alone. Reading the relevant instructions before changing data or trading settings is usually faster than repairing a chartbook after trial and error.
Common Configuration Errors
Frequent errors include using the wrong contract month, selecting delayed data, applying an unsuitable session template, setting an incorrect tick size, or referencing the wrong chart from a study. Other problems come from trading simulation when live mode was intended, or the reverse.
A systematic check can isolate faults. Confirm the active service, connection status, symbol, chart time zone, session schedule, and data timestamps. For trading issues, confirm account selection, simulation status, order quantity, and service permissions before changing unrelated settings.
Advantages and Constraints
Sierra Chart’s strengths include detailed chart construction, local data control, advanced order-flow displays, flexible volume profiles, historical depth tools, direct chart trading, and C++ development support. It can handle both discretionary and rule-based workflows within the same application.
The platform also gives users control over calculations that many browser products keep fixed. Session definitions, profile periods, record granularity, study inputs, and visual presentation can be adjusted with precision. This makes Sierra Chart useful for traders whose methods depend on consistent data treatment.
The main constraints are setup time, desktop dependence, and the separation between platform access, market data, exchange agreements, and brokerage services. The interface favors function over visual simplicity. Mobile access is not its main purpose, and users who want social feeds or prebuilt strategy marketplaces may prefer another platform.
Configuration freedom can itself create errors. A chart may look polished while using the wrong session, contract, or data field. Verification matters more than appearance, particularly for order-flow work where small data differences can change the printed values.
Who Sierra Chart Suits
Sierra Chart is well suited to active futures traders, order-flow analysts, systematic developers, and users who want direct control over chart calculations and execution settings. It is also relevant for traders who maintain detailed replay routines or require locally stored intraday records.
It may be a poor fit for users who mainly trade from a phone, want immediate browser access, or prefer an interface with very few controls. Beginners can learn the platform, but they should expect a structured setup process rather than instant familiarity.
The best test is whether the platform supports a defined analytical and trading process. A trader who needs session profiles, Numbers Bars, ladder execution, and historical depth may make good use of its capabilities. Someone who needs two moving averages and occasional mobile orders may gain little from the added configuration.
Practical Evaluation Before Live Trading
Before using Sierra Chart with live capital, a user should verify data quality, exchange permissions, symbol mapping, session times, and trading-service behavior. Order types and attached orders should be tested in simulation, including cancellation, modification, disconnect, and reconnect procedures.
The next step is to review the trade log and confirm that quantities, prices, commissions, and position calculations appear as expected. If automated code is involved, logs should show how the system responds to partial fills, rejected orders, restarts, and pre-existing positions.
Backups should be created after the workspace is stable. Saving a clean chartbook, study collections, custom files, and a known working program version reduces recovery time after an accidental change or computer failure.
Sierra Chart provides a capable environment for detailed charting, futures data analysis, volume-at-price work, market-depth review, discretionary execution, and custom development. Its value comes from accurate configuration and disciplined use rather than the number of studies placed on a screen. For traders prepared to manage data, settings, and local software, it offers a high degree of control with relatively little hand-holding.