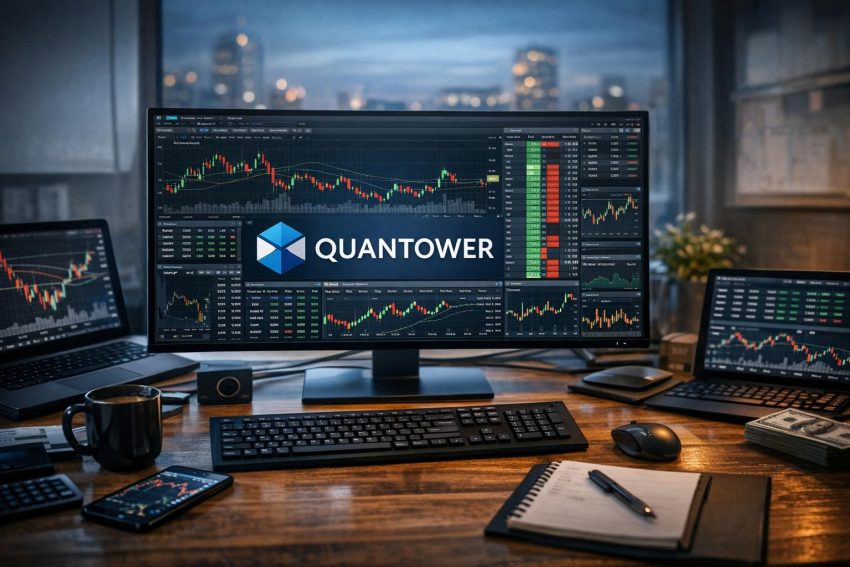
Quantower is a multi-asset trading and market-analysis platform for traders who use different brokers, exchanges, and data providers. It combines charting, order entry, market depth, volume analysis, account monitoring, and portfolio functions in one Windows desktop application. Quantower is not a broker and does not hold client money. It serves as the software interface between the trader and a supported financial service.
The platform covers futures, stocks, options, foreign exchange, cryptocurrencies, and contracts for difference. Instrument availability depends on the connected broker or exchange. Data quality, historical coverage, order types, commissions, leverage, and trading hours also come from the connected service rather than Quantower itself.
This distinction matters in daily use. Two traders can run the same Quantower version but receive different market data and execution features because they use different connections. One may have full order-book data and server-held bracket orders, while another receives top-of-book quotes and basic order entry. Quantower supplies the terminal, but the broker, exchange, and data vendor shape much of the actual trading experience.
What Quantower Is and How It Works
Quantower is a modular trading terminal built around configurable panels. Each panel handles a task such as charting, order entry, account monitoring, market depth, time and sales, watch-list management, options analysis, or volume research. Traders can place several panels within one workspace and arrange them across one or more monitors.
The platform connects to financial services through supported integrations. After installing the application, a user selects a connection and enters credentials supplied by a broker, exchange, or data company. Quantower then requests market data, account records, positions, and order status through that connection. If trading permission is available, the terminal can transmit orders as well.
Quantower does not replace the legal account relationship between the trader and the brokerage firm. Deposits, withdrawals, identity checks, tax records, account protection, and custody remain with the financial provider. Questions about margin calls, execution disputes, or missing funds must generally be directed to that provider.
A trader can sometimes run several connections at once. A futures user might obtain market data through one service while routing orders through another. A cryptocurrency trader may monitor several exchanges from a shared workspace. These arrangements require careful symbol mapping because one provider may label an instrument differently from another.
Connection-dependent features
Not every Quantower function works identically with every integration. The platform may display an advanced order button, but the connected broker might not accept that instruction. Historical tick records may be available through one data service but absent through another. Account statistics can also differ based on the fields supplied by the brokerage system.
Before paying for software or data, traders should verify the following points with both Quantower and the provider:
- Supported asset classes and tradable instruments
- Real-time, delayed, and historical data availability
- Permitted order types and time-in-force choices
- Whether protective orders are held remotely or on the local computer
- Account, position, margin, and commission reporting
- Restrictions tied to residence, account type, or market permissions
This check prevents a common problem: subscribing to a desirable platform module and then learning that the chosen connection does not supply the records required to run it.
Supported Markets and Financial Connections
Quantower has integrations for a range of brokerage firms, exchanges, execution services, and market-data providers. The connection list changes as services are introduced, revised, or retired. Traders should review the current directory before opening an account solely for use with the platform.
Market access should not be judged by an integration name alone. A connection may cover only part of a provider’s product range. It may support live trading but not simulation, or provide quotes without historical depth records. Some connections also require a separate desktop gateway, API subscription, or professional data classification.
Futures trading
Futures traders can use compatible data and execution services to access exchange-listed contracts. Depending on the provider, this may include equity index, energy, metals, agricultural, currency, and interest-rate futures. The trader must subscribe to the relevant exchange feed if real-time quotes are required.
Exchange data charges often vary between non-professional and professional users. Declaring the wrong status can lead to billing problems or suspended access. Futures users must also distinguish between market-data fees, brokerage commissions, clearing charges, exchange charges, and platform costs. A low headline commission rarely represents the full round-turn expense.
Contract selection needs attention as well. Futures expire, and the active contract changes over time. Quantower may show continuous chart symbols for analysis, but live orders must usually be routed to an individual contract month. A chart built from a back-adjusted continuous series can display prices that do not match the live contract exactly.
Cryptocurrency trading
Compatible cryptocurrency connections can cover spot products, margin accounts, perpetual contracts, dated futures, or options. Product support varies widely between exchanges. The same asset ticker may refer to a spot pair on one venue and a leveraged derivative on another.
Traders should check the settlement currency, contract size, funding method, minimum order amount, price increment, and quantity increment before submitting an order. A perpetual contract quoted in a stablecoin behaves differently from an inverse contract settled in cryptocurrency. Profit-and-loss figures may also appear in the settlement asset rather than the trader’s home currency.
Exchange account settings can affect API trading. Users may need to create API credentials and assign read or trade permissions. Withdrawal access should generally remain disabled unless it is genuinely required. IP restrictions, two-factor authentication, and API access controls can reduce account exposure if credentials are compromised.
Foreign exchange and CFDs
Foreign-exchange and CFD access depends heavily on the broker. Spreads, swaps, commissions, available symbols, leverage, and execution rules come from that firm. Quantower can present the quotes and order controls, but it cannot standardize pricing across providers.
Spot foreign exchange does not trade through one centralized exchange. Order-book or volume records may represent activity seen by one broker or liquidity source rather than the entire market. Traders using order-flow displays should account for this difference when comparing foreign exchange with centralized futures contracts.
CFD symbols require similar care. A broker may offer a cash-index CFD, a futures-linked CFD, and an exchange-traded future with related names. Each product can have different trading hours, financing charges, price behavior, and contract values.
Stocks and options
Stock access can include exchange quotes, charting, watch lists, and order routing where supported. Traders may need market-data subscriptions for each exchange or consolidated quotation service. Delayed quotes can be adequate for research, but they are unsuitable for precise live order management.
Options workflows depend on access to chains, strikes, expirations, bid and ask quotes, open interest, implied volatility, and risk measures known as Greeks. Data permissions may differ from those used for stock quotes. Multi-leg trading support must be checked separately because displaying several option contracts does not mean the broker accepts a combined strategy order.
Workspaces and Interface Design
Quantower uses workspaces to store panel arrangements and many related preferences. A workspace might contain one chart and a basic order ticket, or it may spread several analytical panels across multiple screens. Traders can create separate layouts for different markets, sessions, or methods.
A futures workspace may combine a candlestick chart, footprint display, depth-of-market ladder, time-and-sales feed, and account panel. A position trader may prefer weekly and daily charts beside a compact watch list. A cryptocurrency user could place several exchange charts next to balances and open orders.
Panels can generally be docked, resized, grouped, or detached. Linked panels can respond to a shared symbol selection, reducing the need to enter the ticker repeatedly. Care is still needed: changing a linked watch-list row can switch the symbol in an order panel, which creates obvious risk if the trader does not verify the instrument before clicking.
Building a practical workspace
Starting with a small layout is usually more effective than opening every available panel. One chart, one order-entry tool, an account view, and an open-orders panel provide enough information for initial testing. More analytical panels can be added once the user knows how symbol links and connection assignments behave.
Screen space also affects usability. A crowded single-monitor layout can hide order status or make quantity fields hard to read. Multi-monitor users gain more room, though detached windows can become awkward when a monitor is removed or display scaling changes. Saving separate layouts for office and laptop use can avoid a fair bit of panel shuffling.
Workspace backups are sensible after any major configuration change. Software updates, damaged settings, or an accidental panel closure can otherwise require manual rebuilding. Traders should also confirm that saved templates retain the correct connection, symbol, session, and order settings.
Quantower Charting Tools
Quantower includes multi-panel charting for technical analysis, trade management, and volume research. Available intervals can include time-based charts as well as tick, volume, range, Renko, or other bar constructions, depending on the platform module and incoming data.
Charts support indicators, drawing objects, annotations, templates, and visual trade markers. Common drawing tools include trend lines, channels, horizontal levels, Fibonacci measurements, text labels, and risk-to-reward boxes. Traders can save preferred visual settings and apply them to other symbols.
Standard indicators may include moving averages, momentum oscillators, volatility bands, volume studies, and trend measures. Calculated values can differ between platforms if session settings, price inputs, bar construction, or historical records are not identical. A 20-period moving average is simple mathematics, but it will not match another terminal if the two applications build candles from different trading sessions.
Historical records and session settings
Chart accuracy depends on the data supplied to the platform. Some connections deliver long histories of tick records, while others provide only recent bars. Reloading a chart through a different data source may change old candles, volume totals, or indicator readings.
Trading-session templates determine which hours are included in each bar. Futures traders may compare a full electronic session with regular cash-market hours. Cryptocurrency markets trade continuously, yet traders may define daily boundaries based on Coordinated Universal Time or another time zone. Those choices affect daily highs, lows, volume profiles, and indicator calculations.
Time-zone settings deserve a routine check. A chart displayed in local time may not align with exchange reports or another trader’s screenshot. Daylight-saving changes can create further confusion. Using one consistent chart time zone across workspaces makes record keeping easier.
Chart trading
Chart trading allows orders to be submitted and managed from the price display. Working orders may appear as horizontal lines that can be dragged to a new price. Stops, targets, entries, and current positions can be viewed alongside recent price action.
This method is fast, but visual convenience does not replace verification. After moving an order line, traders should check the open-orders panel to confirm that the broker accepted the change. A line may appear at a new level briefly even if an amendment is rejected or delayed.
Order quantity also deserves attention when switching symbols. One futures contract, one stock share, and one cryptocurrency unit have very different monetary exposure. Preset quantities can save time, though an old preset attached to the wrong product can create an oversized position.
Depth of Market and Order Entry
The depth-of-market panel, commonly called a DOM, displays bids and offers at multiple price levels. Depending on the feed, it may show order-book size, recent trades, working orders, position data, and realized or unrealized profit and loss.
Active futures and cryptocurrency traders often use the DOM for short-term execution. Orders can be placed by clicking a price level, using preset buttons, or submitting instructions through an attached ticket. Supported choices may include market, limit, stop, stop-limit, and other broker-approved orders.
Displayed liquidity is not a promise that an order will fill at the shown price. Orders can be cancelled before execution, and a market order may trade across several levels. During fast price movement, the visible book can change faster than a person can react.
Market, limit, and stop orders
A market order prioritizes execution rather than price. It can be appropriate when entry or exit speed matters, but slippage may be large in thin markets or volatile periods. A limit order sets the worst acceptable price, although it may remain unfilled.
A stop order activates after the market reaches its trigger. Once triggered, it may become a market order or a limit order, depending on the instruction. Stop-limit orders provide price control but can fail to execute if the market moves through the limit too quickly.
The exact trigger method can vary. Some brokers use last-traded price, while others refer to bid, ask, mark price, or an exchange rule. Traders should not assume that a stop behaves the same way across futures, CFDs, and cryptocurrency derivatives.
Bracket and linked orders
Bracket arrangements pair an entry with a protective stop and profit target. One-cancels-the-other logic may remove the remaining exit after its partner fills. This structure can reduce manual work, particularly during short-term trading.
The location of that logic matters. Server-held orders can remain active at the broker or exchange after the local computer disconnects. Locally managed orders may require Quantower and the internet connection to remain running. If the local terminal closes, a protective instruction may no longer update or transmit.
Partial fills add another layer. A ten-contract entry might fill in several pieces, and the linked exits must adjust to the actual position. Demo testing should cover partial fills, order amendments, cancellations, disconnections, and application restarts before the same setup is used with live funds.
Volume Analysis and Order Flow
Quantower is often considered by traders who want footprint charts, volume profiles, cumulative delta, time and sales, and liquidity displays. These tools organize completed trades and quoted orders in more detail than a standard candlestick chart.
Order-flow data describes recorded market activity. It does not identify every participant’s motive, and it cannot reliably classify each trade as informed buying or distressed selling. The figures are useful observations, not a direct view into trader intent.
Footprint charts
A footprint chart breaks each bar into price levels and can display bid volume, ask volume, total volume, or delta. Delta commonly represents ask-traded volume minus bid-traded volume. Positive delta suggests more aggressive buying during the measured period, while negative delta suggests more aggressive selling.
Traders may watch for imbalances, unfinished auctions, high-volume clusters, or cases where price moves in the opposite direction from delta. Such patterns require context. A positive-delta bar near resistance does not automatically predict reversal, just as a negative-delta bar near support does not guarantee a rally.
Feed quality has a direct effect on footprint output. Aggregated records, missing ticks, or provider-side corrections can change the numbers. Comparing footprint values across terminals only makes sense when both platforms use equivalent feeds, sessions, and calculation settings.
Volume profile
Volume profile groups traded volume by price rather than only by time. Common reference points include the point of control, value area, high-volume nodes, and low-volume areas. Profiles can cover a session, a chosen range, or the visible portion of a chart.
The point of control marks the price with the greatest recorded volume within the chosen sample. A value area represents a selected percentage of volume around that distribution. Calculation methods can differ, so traders should review settings before comparing levels with another platform.
Profiles summarize prior activity. They do not force the market to stop, reverse, or accelerate at a given price. A level that worked during one session can become irrelevant after new economic data, a contract rollover, or a change in market participation.
Cumulative delta and time and sales
Cumulative delta adds the difference between ask-side and bid-side executions over time. Traders may compare its direction with price to identify divergence. Yet divergence can persist for long periods, and trade classification methods are not flawless.
The time-and-sales panel lists completed trades, often with time, price, and quantity. Filters can remove smaller prints or highlight larger transactions. This may help an active trader follow execution pace, though rapid feeds can produce more records than a person can interpret sensibly.
Centralized futures data generally provides a consolidated record for one exchange contract. Spot foreign-exchange data represents the connected provider’s activity. Cryptocurrency liquidity is divided across exchanges, so an order-flow display from one venue does not show every trade in the broader market.
Options and Portfolio Analysis
Quantower may provide options tools when the connection supplies the required data. An options chain can organize contracts by expiration and strike, with bid, ask, volume, open interest, and implied-volatility figures. Available fields depend on the market-data package.
Greeks estimate how an option’s theoretical value responds to price, volatility, time, and interest-rate changes. Delta, gamma, theta, and vega are model-based measures rather than fixed facts. Values can vary between platforms because each service may use different assumptions or pricing methods.
Traders managing spreads should determine whether Quantower sends each leg separately or routes a recognized multi-leg order. Separate transmission creates execution risk because one leg may fill while another remains open. Exchange-supported combination orders can reduce that exposure, but availability depends on the broker and contract.
Portfolio panels can display balances, positions, working orders, and profit-and-loss figures across supported accounts. Currency conversion may affect totals where accounts contain assets denominated in different currencies. A displayed portfolio value should be compared with the broker statement, especially around settlements, funding payments, option exercises, and corporate actions.
Simulation and Practice Trading
Simulation provides a safer setting for learning Quantower’s controls. Users can practice entering orders, moving stops, reversing positions, changing quantities, and managing workspaces without placing live capital at risk.
A useful practice session should include more than placing a profitable sample trade. Traders need to test rejected orders, accidental clicks, rapid cancellations, connection loss, and platform restarts. The awkward cases tend to expose configuration problems faster than a calm market does.
Simulated results do not equal live execution. A simulator may fill a limit order as soon as price trades at that level, even though a live order would have been behind many others in the queue. Slippage, partial fills, latency, spread changes, and exchange throttling may also be represented poorly.
| Area | What simulation can test | What may differ live |
|---|---|---|
| Order entry | Buttons, quantities, prices, and shortcuts | Rejections, delays, and broker risk checks |
| Bracket orders | Basic stop and target behavior | Partial fills and remote order handling |
| DOM trading | Click sequence and layout | Queue position and changing liquidity |
| Strategy testing | Rule logic and record keeping | Slippage, outages, and live-market latency |
Commission settings should be included where possible. A short-term method can look profitable before fees and lose money after commissions, exchange charges, spread, and slippage are counted. Simulation is most useful when its assumptions are conservative rather than flattering.
Automation, Indicators, and Extensions
Quantower supports custom indicators, strategy development, and extensions through available development tools. The exact scope depends on the platform release, license, and connection. Users considering automated trading should confirm whether a strategy can transmit orders through their chosen provider.
Historical testing is only one stage of strategy evaluation. Backtests can be distorted by poor records, future data leakage, unrealistic fills, omitted commissions, and parameters selected to fit old price behavior. A model that performs neatly on a chart can behave quite differently once orders meet a live book.
Automated systems should include position caps, daily loss controls, duplicate-order prevention, connection monitoring, and detailed logs. A manual stop control is also prudent. If an algorithm begins sending unwanted orders, the trader needs a direct method to disable it and cancel working instructions.
Alerts offer a simpler form of rule-based monitoring. They may track price levels, indicator conditions, or other events. Traders should verify whether alerts run on the local computer or remotely. A local alert will usually stop if Quantower closes, Windows sleeps, or the connection fails.
Pricing, Licensing, and Running Costs
Quantower has used free and paid access arrangements, with feature availability varying by plan and connection. Some brokerage partnerships may include access to selected modules, while other users may need a direct subscription. Prices and plan terms can change, so current details should be checked before purchase.
The software fee is only one part of the cost. A complete budget may include:
- Quantower license charges
- Broker commissions and clearing fees
- Exchange or market-data subscriptions
- Historical tick or depth records
- Currency conversion and financing costs
- Third-party indicators, servers, or API access
Free platform access does not mean cost-free trading. Futures exchange feeds may carry monthly charges, and professional classification can make them considerably more expensive. CFD and foreign-exchange brokers may recover costs through spreads or overnight financing rather than an obvious ticket commission.
Before selecting a plan, users should compare required features against the connection they intend to use. Paying for an advanced volume module has little value if the feed supplies only aggregated bars. Renewal terms, trial expiration, cancellation procedures, and taxes should also be reviewed.
Installation and Initial Configuration
Quantower is primarily a Windows desktop application. Installation usually involves downloading the official installer, creating or signing into a platform account, and adding a broker or data connection. Some providers require a separate gateway or API setup.
Credentials should be stored carefully. Cryptocurrency API permissions deserve extra scrutiny, and withdrawal authority should not be granted without a genuine operational need. Traders should also keep Windows, security software, and the trading application updated.
A sensible setup sequence
Begin with one connection and a compact workspace. Confirm that the account balance, symbol, market status, and quote timestamps appear correctly. Then check whether data is delayed or real time. A live-looking chart can still be delayed by several minutes.
Next, verify the instrument details. Futures users should confirm contract month, tick size, tick value, and trading session. Stock traders should check exchange listing and currency. Cryptocurrency users need to verify spot or derivative status, contract settlement, and quantity units.
Use a demo account to submit a small market order, limit order, stop, amendment, and cancellation. Check each action in the order and account panels. Test what happens when the application disconnects, then verify whether working orders remain at the broker.
After the basic workflow behaves as expected, save the workspace and create a backup. Only then is it sensible to add footprint charts, extra feeds, custom indicators, or automated functions. Starting small is not glamorous, but it reduces expensive surprises.
Performance, Stability, and Hardware
Platform performance depends on computer resources, data volume, panel count, and the number of active connections. Several footprint charts with long tick histories can use far more memory and processor capacity than a pair of basic candlestick charts.
Users should monitor processor load, memory use, disk space, and network stability during active sessions. Wireless internet may be adequate for analysis, but a wired connection can provide steadier execution. Traders who rely heavily on the terminal may also consider backup internet access and an uninterruptible power supply.
Loading too much historical data can slow startup and chart refreshes. It is usually better to request the amount needed for the method rather than years of tick records on every symbol. Closing unused panels and inactive connections can also reduce load.
Software updates should be handled with care. Release notes can indicate connection changes or corrected behavior. Traders may prefer to test a new version in simulation before using it during an active session, especially if custom scripts or broker gateways are involved.
Advantages of Quantower
Quantower’s main benefit is consolidation. A trader can monitor several supported markets and accounts from one application rather than maintaining a separate terminal for every provider. Shared layouts and familiar controls can reduce the time spent switching software.
The modular interface supports both simple and detailed setups. Traders can create a basic charting station or combine market depth, footprint data, volume profiles, account views, and order controls. Saved workspaces make it practical to separate futures, options, cryptocurrency, or longer-term analysis.
Volume and order-flow functions are another reason traders consider Quantower. Many broker terminals provide competent charts but fewer tools for examining activity at each price. Quantower places these analytical functions beside direct order controls, which can suit discretionary futures and short-term traders.
Connection choice is also useful for traders who change brokers. If both the old and new providers are supported, part of the existing workspace may remain usable. The trader still needs to verify symbols and order behavior, but there may be less retraining than with an entirely different terminal.
Constraints and Practical Risks
Quantower requires more setup than many broker-owned applications. Connections, feeds, symbol mappings, panels, and account permissions must work together. Users who only want to buy a few stocks and review account statements may find the platform more involved than necessary.
Feature support is uneven across integrations. A function shown in the interface might receive incomplete data from one provider or lack trading support through another. This is not always obvious until the connection is tested.
Multi-connection use can also introduce mismatches. A chart from one feed may show a price that differs from the execution broker’s quote. Differences in session rules, symbol construction, latency, or contract adjustment can affect entries and stops. Orders should be based on the prices recognized by the execution connection.
There is also operational risk. Local hardware failure, internet loss, incorrect API permissions, software freezes, and user error can interrupt trading. Remote protective orders, conservative position sizing, and a backup method for contacting the broker help reduce the impact.
No analytical display removes market risk. Footprint charts, depth ladders, and profiles describe available records; they do not provide certainty. Leverage can produce losses faster than a trader can adjust a workspace, which is a rather expensive way to learn where the cancel-all button sits.
Who Quantower May Suit
Quantower may suit active futures, cryptocurrency, foreign-exchange, options, and stock traders who want several analytical and execution tools in one desktop terminal. It is particularly relevant to users who value market depth, footprint charts, volume profiles, chart trading, and configurable multi-monitor workspaces.
The platform can also make sense for traders who use more than one supported broker or data provider. A common interface can simplify monitoring, provided that each connection’s differences are documented and tested.
Quantower may be a poorer fit for mobile-first investors, infrequent traders, or users who prefer a minimal order ticket tied closely to one broker. It also requires time for setup and practice. Someone who has no use for order flow or multi-provider access may receive little benefit from the extra controls.
Final Assessment
Quantower is a capable Windows trading terminal that combines charting, execution, market depth, volume analysis, portfolio monitoring, simulation, and connection management. Its main appeal comes from flexible workspaces and support for multiple financial services rather than from acting as a brokerage firm.
The quality of the experience depends on the broker, exchange, and data feed connected to it. Historical coverage, order types, server-held protection, market permissions, fees, and instrument access must be checked at the provider level. The same platform can perform very differently across two accounts.
Prospective users should test Quantower in simulation, confirm live-data status, review contract details, and verify how orders behave after a disconnection. Pricing should be assessed alongside commissions, exchange charges, data fees, and financing costs. With those checks completed, Quantower can serve as a practical terminal for traders who need more control than a basic broker platform normally offers.