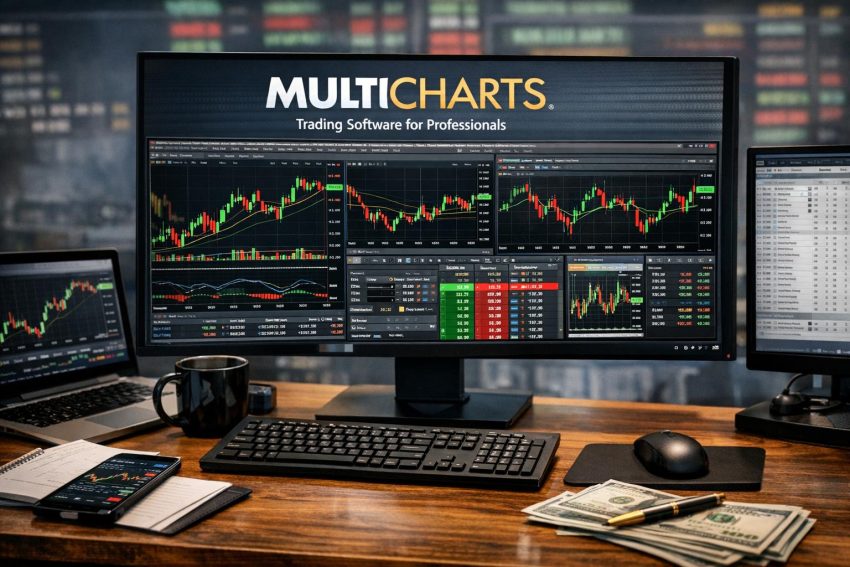
MultiCharts is a desktop trading and technical analysis platform for traders who study markets, program rule-based strategies, run historical tests, and automate order execution. It combines charting, coding, strategy reports, portfolio testing, and broker connectivity within a single Windows application. This makes it more capable than a basic chart package, though it also asks more of the user.
The platform is commonly associated with PowerLanguage, a programming language compatible with much of the syntax used by TradeStation EasyLanguage. Traders with existing EasyLanguage studies may be able to move or adapt their code, depending on the functions, data structure, and platform features involved. MultiCharts also has products associated with the Microsoft .NET framework for developers who prefer languages such as C#.
MultiCharts can serve individual discretionary traders, systematic traders, software developers, and firms that run several strategies or market connections. The proper setup depends on the instruments traded, required data history, broker support, operating schedule, and programming method. Product editions, supported connections, licensing terms, and prices can change, so prospective users should confirm current details with the software developer, broker, and data provider.
What MultiCharts Does
MultiCharts brings several trading tasks into one local application. Users can display historical and live market data, apply technical studies, create custom indicators, program trading signals, test strategies, and route orders through compatible brokerage connections.
A discretionary trader may use MultiCharts mainly for chart analysis and manual order placement. A systematic trader may program entry and exit rules, assess those rules against past data, and allow the platform to submit orders automatically. Many users work between those two approaches. They may automate routine entries while retaining manual control over risk, or use programmed alerts without permitting the software to send an order.
The platform’s core functions can be grouped as follows:
| Function | Common use | Main concern |
|---|---|---|
| Charting | Reviewing price, volume, indicators, and market relationships | Correct sessions, symbols, and data intervals |
| Programming | Building indicators, functions, and trading signals | Code may compile even when the trading logic is wrong |
| Historical testing | Estimating how rules behaved on past data | Fill assumptions, fees, slippage, and data quality |
| Parameter testing | Comparing input values across a chosen test period | Curve fitting and repeated use of the same sample |
| Portfolio testing | Reviewing strategies across several instruments | Capital, margin, correlation, and position overlap |
| Order automation | Sending strategy orders to a supported broker | Connection loss, position mismatch, and operational failure |
MultiCharts is normally installed on a Windows computer rather than run mainly through a browser. Local installation gives the user direct control over workspaces, code files, data settings, and connections. That control comes with routine responsibilities: software updates, computer security, file backups, internet access, power continuity, and system monitoring.
A local trading station may be adequate for manual analysis or occasional strategy testing. Traders running automation during long exchange sessions often use a dedicated computer or hosted Windows server. The right choice depends on trading hours and acceptable downtime. A strategy cannot manage an open position if the computer running it has shut down.
MultiCharts Editions and Product Selection
The MultiCharts name has been used for more than one product configuration. The standard desktop product is known for PowerLanguage compatibility, multiple data feeds, broker connections, charting, and automated execution. A .NET-oriented edition has also been offered for users who work with Microsoft development tools. Availability and product terms should be checked before purchase because version policies may change.
Edition choice should begin with the intended workflow rather than a long feature checklist. A trader who already owns EasyLanguage studies will usually care about code compatibility. A C# developer may place more weight on .NET support. A futures trader may care most about contract handling, exchange data, broker routing, and continuous futures settings.
License cost is only one part of the budget. A realistic calculation may include exchange subscriptions, broker commissions, regulatory charges, data vendor fees, third-party indicators, server hosting, backup internet access, and development time. Historical tick data can also carry a separate cost, especially when many years or many contracts are needed.
Prospective users should verify the exact broker and data connection they plan to use. A general statement that the software supports a broker does not necessarily mean every asset class, account type, regional branch, or order instruction works in the same manner. Testing the intended setup is safer than assuming compatibility from a product name alone.
Charting and Market Analysis
MultiCharts supports chart-based study of price, volume, and derived market data. A chart can display a single instrument or several data series. Multiple series allow calculations that use different intervals, related instruments, or reference markets.
A trader might place five-minute bars on the first data series and daily bars on the second. The daily series could define trend direction, while the intraday series controls entry timing. Another study might compare two futures contracts, calculate a spread, or use an equity index as a filter for individual share trades.
Mixing data series requires care. Each series can have its own session, interval, and stream of timestamps. A calculation that appears straightforward may behave differently if one market closes earlier, has missing bars, or uses another time zone. Before trusting a multi-data chart, the user should inspect how bars align and when each calculation updates.
Chart Types and Bar Construction
Common chart intervals include daily, weekly, minute, tick, and volume bars. Depending on the feed and platform configuration, users may also work with other bar-building methods. Each method answers a slightly different research question.
Time-based bars group transactions into fixed periods. Tick bars create a new bar after a chosen number of trades or updates. Volume bars use traded volume as the threshold. Two charts covering the same session may therefore contain very different bar counts and indicator readings.
Bar construction affects strategy testing. A moving average based on 500-tick bars does not carry the same meaning as one based on five-minute bars. Tick and volume bars may also vary between feeds because vendors can process trade records differently. The trader should use the same data conventions during research and live operation where practical.
Indicators, Drawing Tools, and Alerts
MultiCharts includes familiar technical studies such as moving averages, oscillators, volatility measures, channels, and volume calculations. Inputs can usually be changed from the study settings window. Users may alter line colors, calculation periods, display formats, and alert conditions.
Drawing tools support discretionary chart work, including trend lines, horizontal levels, text labels, and other annotations. These objects help document a trading plan, though manually drawn marks do not automatically become testable rules. A line that looks obvious after a market move still needs a precise definition before it can be coded.
Alerts can notify a trader when a condition occurs. Depending on configuration, alerts may appear on screen, produce a sound, or use another supported notification method. They are useful for semi-automated workflows, but they still depend on the application, chart, and data connection remaining active.
Templates and Workspaces
A chart template stores many chart and study settings, allowing the same layout to be applied elsewhere. A workspace holds a broader arrangement of charts and application windows. Traders who follow several markets can use workspaces to separate research, live monitoring, and strategy development.
Keeping live and research workspaces separate reduces accidental changes. It is surprisingly easy to alter an input during testing and forget that the same chart also controls automation. Clear names, version labels, and dated backups help prevent that sort of avoidable mess.
PowerLanguage Programming
PowerLanguage is the main programming language used in the standard MultiCharts workflow. Its trading-oriented syntax allows users to define indicators, functions, and signals without building a full application from scratch. Traders familiar with EasyLanguage will recognize many statements and structural conventions.
An indicator calculates and displays information but does not normally place a trade. A signal contains trading instructions that can be assessed historically or connected to automated execution. A function stores reusable logic that can be called by indicators or signals. Keeping these roles separate makes code easier to test and maintain.
A basic trading signal may compare two moving averages and buy when the shorter average crosses above the longer average. A more developed version could restrict trades to set hours, check current volatility, size the position from account risk, and place protective exits after entry.
Inputs and Variables
Inputs let the user change a value without editing the main program. Common inputs include lookback length, stop distance, start time, end time, and position size. They are also used during parameter testing.
Variables store values calculated while the code runs. A variable might hold the current moving average, highest price over a chosen period, entry price, or daily trade count. Variable handling deserves close attention because an incorrect reset or update can alter every trade in a test.
Names should communicate purpose. A variable called DailyLoss is easier to audit than one called X3. Brief comments can explain assumptions, but comments should not become a substitute for clean code. Six months after writing a signal, the author is often the stranger who has to maintain it.
Orders and Timing
Trading signals can issue market, stop, and limit instructions, subject to platform syntax and broker support. The timing of an instruction matters. Some rules act after a bar closes and target the next bar. Other configurations may calculate during an open bar.
A close-of-bar system usually waits for final bar values. An intrabar system reacts as prices change. Intrabar calculation can better represent fast trading rules, but it also increases the chance of differences between historical and live behavior. Historical bars do not always retain every calculation state that occurred while the bar formed.
Traders should document whether a rule uses completed bars, current bars, or lower-resolution data. They should also record how orders are cancelled, replaced, or retained across sessions. An entry rule is only half a strategy; order state management often causes the harder bugs.
Code Verification Is Not Strategy Validation
The PowerLanguage editor can check syntax and compile code. Successful compilation means the platform can process the program. It does not mean the program expresses the trader’s intended rule, uses correct data, or manages risk properly.
Logical errors can be subtle. A comparison may use the current bar when the author intended the prior bar. A session counter may fail to reset. A stop may be expressed per contract when the author thought it applied to the whole position. Every strategy should be reviewed through chart markers, trade lists, and small controlled tests.
Using .NET-Based Development
Developers with general software experience may prefer a MultiCharts product that supports the Microsoft .NET framework. This route can allow use of C# conventions, object-oriented design, external libraries, and standard development practices.
.NET development can suit research teams that already maintain shared code, testing tools, databases, or internal analytics. It may also be useful where PowerLanguage becomes awkward for a large project. Greater programming freedom, however, creates more maintenance work. External packages can change, dependencies can fail, and software updates can affect compatibility.
The decision should reflect the project rather than the programmer’s pride. A short moving-average signal does not need an elaborate software architecture. A multi-strategy research system with shared data models may benefit from one. Plain code that can be audited often beats clever code that only its author can explain.
Historical Backtesting
Backtesting applies programmed rules to past market data. MultiCharts can produce reports containing net profit or loss, trade count, average trade, drawdown, winning trade rate, profit factor, and related measures. These figures help describe historical behavior, but none proves that future trading will be profitable.
A useful backtest starts with a clearly defined rule. Entry timing, exit timing, order type, trade size, session hours, fees, and slippage should all be stated. If those assumptions remain vague, the report may look precise while measuring a strategy that could never have traded as shown.
Historical Data Quality
Missing records, bad ticks, time-zone changes, altered sessions, and inconsistent contract histories can affect results. Stock data may require adjustments for splits or dividends. Futures research must account for contract expiration and rollover. Foreign exchange feeds can differ because there is no single centralized transaction stream for the entire market.
Longer history is not automatically better. A market’s contract terms, trading hours, tick size, or liquidity may have changed. Old data can still be useful, but the user should know whether it represents conditions relevant to the proposed strategy.
Data should be checked visually and statistically. Sudden isolated spikes, long gaps, duplicated bars, or unusual volume values deserve review. A strategy that earns most of its reported profit from one bad price record has not found a trading edge; it has found a database problem.
Commissions, Spread, and Slippage
Gross backtest profit can give a misleading impression, especially for systems with frequent trades. Brokerage commissions, exchange fees, and regulatory charges reduce each trade’s result. Bid-ask spread creates another cost because buys often occur near the ask and sells near the bid.
Slippage measures the difference between an assumed order price and the achieved price. It can arise from latency, thin liquidity, rapid movement, queue position, and order size. A fixed slippage value is easy to model but may not represent stressful periods. Testing several plausible cost assumptions gives a more useful range.
Limit orders present another issue. Touching a limit price does not prove that the order would have filled. Other orders may have been ahead in the queue, or traded volume may have been too low. Conservative fill assumptions are generally more defensible than assuming every touched limit order was executed.
Intrabar Price Sequence
A standard bar provides open, high, low, and close values, but it may not show whether the high occurred before the low. That order matters when both a stop and profit target fall inside the same bar.
Suppose a strategy buys at the bar open, with a stop below and a target above. If both prices appear within that bar, the outcome depends on which was reached first. Lower-interval or tick data can provide a more accurate sequence. Without it, the backtest must follow platform assumptions that may favor or hurt the reported result.
Intrabar order generation and bar magnification settings should be chosen with the strategy’s holding period in mind. A monthly trend system may not need tick-level reconstruction. A short-term futures strategy that enters and exits within a minute often does.
Reading a Performance Report
Net profit alone is a weak basis for judgment. A trader should review drawdown, trade count, average trade, distribution of returns, time in the market, and dependence on a few exceptional trades. A system with a high reported profit but a tiny average trade may fail after realistic costs.
Trade count affects confidence in the result. Ten trades do not provide the same evidence as several hundred, though a high count cannot rescue poor test design. Results should also be separated by year, market condition, direction, and instrument where relevant.
Maximum historical drawdown deserves attention, but future drawdown can exceed it. Position size should not be set on the assumption that the worst past period represents a firm boundary. Markets have no obligation to respect a backtest report.
Parameter Testing and Curve Fitting
MultiCharts can compare combinations of strategy inputs across historical data. A trader might test several moving-average periods, breakout lengths, or stop distances. The resulting table can show whether performance changes gradually or depends on one narrow parameter combination.
The largest historical profit is rarely the only result worth considering. A broad area of acceptable performance may offer stronger evidence than one sharp peak surrounded by poor outcomes. A narrow peak often suggests that the rules have matched noise in the sample.
Curve fitting occurs when a strategy is adjusted too closely to past data. The danger rises as more rules and inputs are tested. Repeatedly reviewing the same holdout period also turns that period into development data, even if the spreadsheet still calls it a holdout sample.
In-Sample and Out-of-Sample Testing
One common method divides data into a development period and a separate evaluation period. The development sample is used to write rules and choose sensible parameters. The evaluation sample checks behavior on records that did not guide those decisions.
A poor evaluation result does not always mean the trading idea has no merit, but it does reduce the evidence supporting the current version. Changing the rules after seeing the evaluation result requires another untouched sample if the user wants a fair test.
Walk-Forward Analysis
Walk-forward testing repeats development and evaluation through successive time windows. Parameters are selected from one window and then applied to the next. The process moves forward through the historical record.
This method can approximate a strategy that updates its parameters periodically. It introduces choices about window length, update frequency, parameter range, and aggregation. Those choices can also be fitted, so walk-forward testing should not be treated as automatic proof of durability.
Resilience Checks
A strategy can be tested with higher fees, worse fills, delayed entries, altered parameters, different start dates, and related instruments. The goal is not to force identical results from every variation. It is to see whether the basic behavior survives reasonable changes.
Traders can also remove the best trades from a report to assess dependence on rare events. Trend-following systems often rely on occasional large winners, so removing them requires interpretation. Still, if one trade accounts for nearly all reported profit, the result deserves caution.
Portfolio and Multi-Market Testing
Testing one strategy on one chart says little about how several positions interact. Portfolio testing assesses rules across a group of instruments or strategies. It can reveal overlapping exposure, capital requirements, clustered losses, and competition for available margin.
A strategy may perform acceptably on crude oil, gold, equity indexes, and government bonds when each is tested alone. In a shared account, several entries may occur on the same day. The account must have enough capital and margin to take those trades. If it cannot, the portfolio needs a method for ranking or rejecting orders.
Correlation also changes during market stress. Markets that appear loosely related during calm periods may move together when traders reduce risk. Portfolio reports should therefore examine the timing of losses, not just the sum of independent results.
Capital allocation rules can use fixed contract counts, equal cash amounts, volatility estimates, or percentage risk. Each method changes the portfolio result. Futures require extra care because one contract can represent very different monetary exposure across markets.
Automated and Semi-Automated Trading
MultiCharts can send strategy orders through supported broker connections. In fully automated operation, the platform generates and transmits orders according to the programmed rules. In semi-automated use, it may display a signal or prepare an order while the trader retains final control.
Automation removes the need to click every order, but it does not remove supervision. Data can stop, a broker session can disconnect, orders can be rejected, and local strategy state can differ from the live account. Traders need procedures for each event.
Strategy and Broker Position Synchronization
The strategy maintains its own view of whether it is long, short, or flat. The broker account records the real position. Those records can diverge after manual trades, rejected orders, connection failures, partial fills, or a restart.
Before enabling automation, the user should know how the platform handles this mismatch. Flattening a broker position manually may not reset the strategy’s internal state. Reapplying a signal to a chart can also produce behavior that differs from simply continuing the prior session.
Risk Controls
Risk rules may operate within the signal, at the platform level, or through the broker. Useful controls include maximum order size, maximum open exposure, daily loss thresholds, and restrictions on trading outside approved hours.
No single control should be assumed infallible. A coded stop depends on the platform running and connected unless the order has already reached the broker or exchange. Broker-side controls can provide another layer, though their availability varies by account and connection.
Emergency procedures should state how to cancel working orders, close positions, contact the broker, and stop automation. Account numbers and dealing-desk contact details should be available without relying on the same computer that just failed.
Simulation and Small Live Tests
Simulated trading can reveal order syntax errors, session mistakes, repeated entries, and position sizing problems. It also allows the user to watch how the strategy behaves as bars form rather than relying only on historical reports.
Simulation cannot reproduce queue position, market impact, every rejection, or the pressure of managing real capital. After simulation, a small live test can provide execution records for comparison. Historical, simulated, and live trades should be reconciled by timestamp, signal, requested price, fill price, and quantity.
Market Data Connections
MultiCharts depends on an external feed or broker connection for market data. Data vendors differ in historical coverage, timestamp policy, correction methods, exchange access, and symbol format. A feed that works well for daily equity charts may not suit tick-level futures research.
Real-time and historical records may come from separate servers or even separate vendors. This can produce a chart whose older section follows one convention while new bars follow another. Traders should check whether reloading a chart changes recent bars or indicator values.
Symbols and Mapping
Data vendors and brokers may use different symbols for the same instrument. The chart symbol must be mapped correctly to the order-routing symbol. Contract month, exchange, currency, and price scale all require review.
An incorrect price multiplier can create a dangerous position size. An incorrect exchange mapping may lead to rejection or route an order somewhere unintended. Symbol setup deserves a written check rather than a quick assumption based on a similar ticker.
Futures Contracts and Rollover
Futures expire, so long historical charts are often built by joining individual delivery months. Continuous futures series can use several rollover dates and adjustment methods. A back-adjusted series may create smooth historical trends but does not represent the actual price traded on each date.
Research should distinguish between the analysis series and the contract sent to the broker. The strategy may calculate signals from a continuous series while orders target the active delivery month. Rollover procedures should state when positions move and how the new contract is selected.
Sessions and Time Zones
Session templates define which trading hours appear in a chart. Changing the session can change daily highs, lows, closes, indicators, and trade signals. Futures markets that trade nearly around the clock are especially sensitive to the chosen session boundary.
The computer clock, data timestamp, exchange time, and chart time zone must be consistent. Daylight-saving changes can create duplicate or missing times if settings are wrong. Strategies with time-based rules should be checked around clock changes and early exchange closes.
Practical Strengths
MultiCharts connects visual analysis with programmable rules. A trader can inspect price behavior, write an indicator, convert the idea into a signal, and review historical trades without moving between unrelated applications.
PowerLanguage is approachable for users who already know trading terminology. Statements related to bars, prices, positions, and orders are often easier to read than equivalent general-purpose code. Compatibility with EasyLanguage-style syntax can also preserve some value from existing studies.
The platform supports advanced chart layouts, multiple data series, custom indicators, strategy reports, portfolio tests, and automated routing. It can therefore remain useful as a trader moves from manual analysis into more systematic work.
Local file control is another practical benefit for users who prefer to manage their own code and workspaces. They can create versioned backups, separate research from live operation, and store project records according to their own policies.
Constraints and Operating Considerations
MultiCharts has a learning curve. Basic charts can be created fairly quickly, but dependable automated trading requires programming knowledge, market mechanics, data management, and operational discipline. The software cannot determine whether a trading premise makes economic sense.
Configuration errors can materially change results. Session hours, time zones, point values, fees, data intervals, and calculation modes all affect strategy output. Two users can run apparently identical code and receive different results because their chart settings or feeds differ.
Compatibility should be checked at the product-version level. A broker connection that worked in an earlier release may require an update after the broker changes its interface. Third-party studies may also depend on older platform behavior.
Desktop automation creates infrastructure duties. Windows updates, antivirus scans, sleep settings, power management, and network maintenance can interrupt trading. A dedicated machine should be configured to avoid unattended restarts during market hours, while still receiving security maintenance under a planned schedule.
How to Start With MultiCharts
A sensible starting process begins with data rather than code. Connect one approved feed, create a chart for a familiar instrument, and verify prices against the broker or exchange records. Set the session, time zone, interval, and price scale before adding studies.
Next, apply a built-in indicator and review how its inputs affect the chart. Create a small custom indicator, then a basic signal with one entry and one exit rule. The purpose is to learn order timing, chart calculation, and report behavior without hiding mistakes inside a large program.
After the first historical test, inspect individual trades rather than focusing only on summary profit. Check that every entry and exit follows the written rule. Add commissions and cautious slippage, then repeat the test on another period and another instrument.
Once historical behavior is documented, run the strategy in simulation during live market hours. Watch chart updates, alerts, order generation, cancellation, and session transitions. Restart the platform under controlled conditions and record how the strategy recovers.
A small live deployment should use position sizes that allow operational testing without putting the account at undue risk. Compare live fills with expected orders and retain logs. Increase size only after the system has produced enough operating evidence and all mismatches have been explained.
Who MultiCharts May Suit
MultiCharts may suit traders who want more programming and testing control than a basic broker platform provides. It is particularly relevant to users familiar with EasyLanguage concepts, traders working with several data feeds, and researchers who need chart-based strategy development.
It may be less appropriate for users who want a browser-only service, do not wish to maintain a Windows computer, or have no interest in programmed rules. Traders who need a broker or asset class not supported by their chosen edition should resolve that issue before buying a license.
The platform can act as a central research and execution application, but its value depends on the process around it. Good data, clear rules, careful code review, realistic testing costs, and reliable operating procedures matter more than the number of indicators installed.
Final Assessment
MultiCharts provides charting, PowerLanguage development, historical testing, portfolio analysis, and automated execution in a mature desktop format. Its EasyLanguage-compatible approach makes it relevant to traders who want to convert written trading rules into programs without beginning with a general software language.
The platform does not turn a weak strategy into a profitable one, and a polished backtest does not guarantee executable returns. Research quality depends on accurate data, defensible assumptions, proper order modeling, and separation between development and evaluation samples.
For traders prepared to manage code, data, broker connections, and computer operations, MultiCharts can provide a coherent base for systematic trading. It is best treated as research and execution infrastructure rather than a source of trading ideas. The software performs the rules it receives; responsibility for those rules remains with the trader.