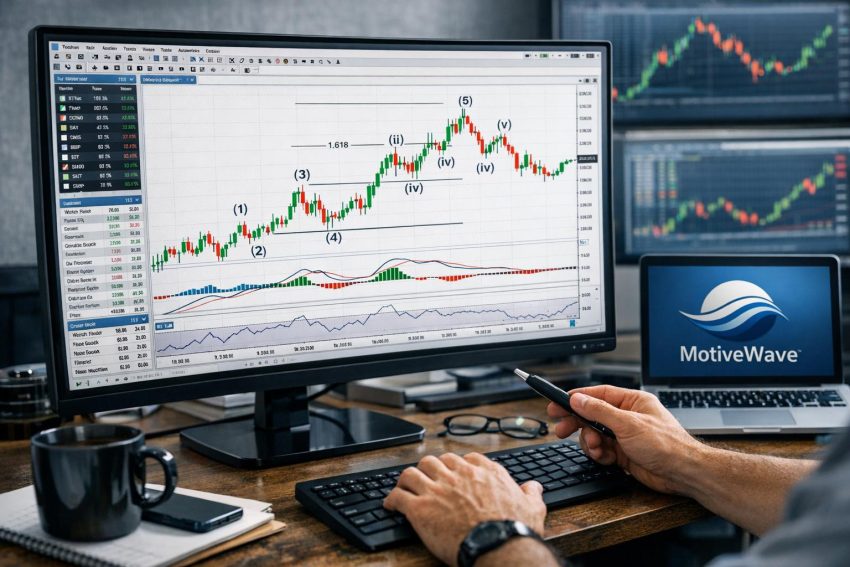
MotiveWave is a desktop trading and technical analysis platform for traders who want charting, market analysis, strategy development, and order execution in one application. It supports several asset classes through connections to compatible brokers, exchanges, and market data providers. The software is commonly used by discretionary traders, technical analysts, educators, and developers who need more analytical depth than basic brokerage software usually provides.
The platform is closely associated with Elliott Wave analysis, customizable technical studies, market and volume profile tools, automated strategies, and multi-timeframe charting. Its use is not restricted to wave analysis, though. Traders can apply conventional indicators, price action methods, volume studies, harmonic patterns, order-flow tools, and algorithmic rules from the same desktop program.
MotiveWave can also serve as a central workstation. A trader may monitor several markets, annotate charts, run scans, receive alerts, test strategies, and route orders without moving between unrelated programs. Whether that setup is practical depends on the chosen edition, the connected services, the trader’s computer, and the quality of the market data.
What Is MotiveWave?
MotiveWave is proprietary software installed on a computer rather than used only through a web browser. Local installation gives the application access to desktop processing resources and allows users to create multi-window workspaces. It can connect to supported brokerage and data services for live quotes, historical records, account details, and order routing.
The program can be used to analyze stocks, futures, forex, options, cryptocurrencies, indexes, and other instruments. Actual access depends on the broker or data provider. A platform may support a category of assets while a chosen connection supports only part of it. A futures data service, as an example, may provide exchange-traded contracts but no stock or option data.
MotiveWave combines functions that are often split across separate applications. These functions include charting, watchlists, scanners, alerts, technical studies, trade simulation, strategy testing, order entry, and account monitoring. Higher software editions may include more advanced analysis and development features than entry-level editions.
MotiveWave is not a brokerage firm. It supplies analytical and trading software, while the connected broker handles custody, order processing, clearing, account statements, and regulatory duties. A user generally needs a separate brokerage account to place live trades. Exchange data subscriptions may also be required, particularly for real-time futures and professional market data.
Desktop Software and Daily Workflow
A desktop platform tends to suit traders who spend regular sessions at a dedicated computer. MotiveWave lets users save layouts containing charts, watchlists, account panels, depth-of-market displays, and trading controls. Once configured, the same arrangement can be reopened for later sessions.
A typical workflow might begin with a watchlist of major indexes, futures contracts, currency pairs, or selected stocks. The trader can open a chart from the watchlist, review higher timeframes, mark support and resistance, and then move to a shorter interval for order timing. Alerts can monitor levels while the user works elsewhere in the program.
Local software also creates maintenance duties. The user must install updates, manage saved workspaces, confirm connection settings, and keep backup access to the brokerage account. A browser platform often handles updates automatically, whereas desktop software may require more direct attention. It is not difficult work, but ignoring it tends to produce trouble at inconvenient times.
Charting and Technical Analysis
Charting is one of MotiveWave’s main functions. Users can open charts for individual instruments and arrange several charts within one workspace. Standard display formats include candlesticks, bars, lines, and OHLC charts. Depending on the data feed and software edition, other formats may include tick, volume, range, Renko, point-and-figure, and related non-time-based charts.
Time-based bars divide trading activity into equal periods, such as one minute, one hour, or one day. Tick and volume charts divide activity according to transactions or traded volume. Range-based charts form bars after price travels a set distance. Each construction method presents market activity differently, so signals may not match across chart types.
Users can compare several intervals for the same instrument. A swing trader might place weekly, daily, and four-hour charts side by side. A futures day trader may prefer hourly, five-minute, and one-minute charts. Linking charts can make symbol changes faster because selecting an instrument in one panel can update related panels.
The platform includes conventional technical studies such as moving averages, Bollinger Bands, MACD, RSI, stochastic oscillators, Average True Range, ADX, rate of change, and volume indicators. Users can adjust calculation periods, input values, colors, line styles, and display positions. Saved templates allow the same group of studies to be applied to other charts.
Indicator settings deserve more attention than they often receive. A 14-period RSI calculated on daily closing prices does not carry the same meaning as a 14-period RSI on a five-minute futures chart. Session settings, missing records, settlement prices, and bar construction can also alter values. If two platforms show different readings, neither is automatically broken; they may simply be using different inputs.
Multi-Timeframe Studies
Multi-timeframe analysis allows a study on one interval to appear within another charting context. A trader could monitor a daily moving average while viewing an intraday chart, or compare weekly momentum with a shorter-term entry signal. This can reduce chart clutter when used with restraint.
Too many timeframe references can make interpretation harder. A chart containing daily, hourly, and intraday indicators may produce opposing signals at the same time. MotiveWave provides the tools, but the trader still needs a written rule for deciding which interval takes priority.
Templates and Reusable Chart Settings
Templates can store indicator combinations and visual settings for repeated use. A trader who analyzes breakouts may save volume, volatility, and moving-average studies as one template. Another template could contain market profile and VWAP tools for intraday futures analysis.
Reusable settings reduce setup time and help keep charts consistent. Even so, applying identical parameters to every asset can be misleading. A slow-moving bond contract and an active technology stock have different volatility, trading hours, and liquidity. Parameters should match the instrument and trading method rather than personal habit alone.
Elliott Wave Analysis
MotiveWave is well known among Elliott Wave practitioners. Elliott Wave theory describes market movement through recurring impulse and corrective structures. Analysts label advancing and declining sections of price movement, then assess possible relationships between those sections.
The platform provides drawing and labeling tools for impulse waves, corrections, diagonals, triangles, combinations, extensions, and related structures. Labels can be organized by wave degree, which helps analysts distinguish a short-term count from a broader count on the same chart.
Wave labeling can become untidy in general charting software. MotiveWave reduces some of that administrative work by managing labels, degree notation, and projected levels. This does not make the interpretation objective. Two experienced analysts can label the same price series differently, especially before a pattern has completed.
Some editions may provide assisted or automated wave-counting functions. These tools review historical prices and propose possible structures based on programmed rules. Their output should be treated as a working interpretation, not a prediction. New price bars can invalidate a count or cause the software to prefer another structure.
Users can maintain alternate counts when more than one interpretation appears reasonable. An analyst might keep a primary bullish count and an alternate bearish count, with price levels that invalidate each view. This approach is generally more practical than treating one label set as fixed.
Fibonacci Measurements
Fibonacci retracements, extensions, projections, and time measurements are often used alongside Elliott Wave analysis. MotiveWave allows users to place these measurements directly on a chart and associate them with marked price swings.
A retracement measures how far a correction has moved relative to an earlier advance or decline. An extension projects beyond a previous swing. A projection compares the length of one move with another. Traders may use clusters of related measurements to identify areas worth monitoring.
These ratios do not compel price to reverse. Their value comes from providing consistent measurement rather than certainty. A Fibonacci level supported by prior price activity, volume distribution, or a broader trend may carry more analytical weight than an isolated ratio drawn after the fact.
Drawing Tools and Chart Annotation
MotiveWave includes trendlines, channels, horizontal levels, vertical markers, pitchforks, geometric shapes, Fibonacci tools, text notes, and other chart annotations. Drawings can be edited after placement and formatted with colors, line widths, labels, and visibility rules.
Visibility by timeframe is useful for keeping charts readable. A long-term support level may need to appear on daily and weekly charts but not on a one-minute execution chart. Short-term notes can be hidden from broader charts. Without such controls, a heavily marked chart can start looking like a railway map drawn during a coffee shortage.
Annotations can also document trade preparation. A trader may mark entry zones, stop areas, projected targets, and invalidation points before the session begins. After the trade, notes can record what occurred. The platform is not a full trading journal by default, but chart annotations can support one.
Workspace Design and Multiple Monitors
A MotiveWave workspace can contain charts, watchlists, scanners, quote panels, trading windows, account data, and depth-of-market displays. Users may save separate workspaces for day trading, swing analysis, strategy research, or different asset groups.
A futures trader might place an index contract on the main monitor, correlated markets on a second screen, and order management panels on a third. A stock trader may prefer a scanner, sector charts, a watchlist, and one primary analysis chart. The platform offers considerable control over window placement.
More panels do not automatically produce better decisions. Every active chart consumes screen space and computer resources. Real-time indicators, scanners, and order-flow displays also place demands on memory and processing power. A smaller, stable setup is often more useful than a crowded arrangement that stalls during an active session.
Workspace backups deserve routine attention. Saved layouts, templates, study settings, and custom code can represent many hours of setup. Users should learn where the program stores configuration files and keep copies away from the primary computer. That precaution becomes valuable after hardware failure or an operating-system reinstall.
Market Profile, Volume Profile, and VWAP
Depending on the edition, MotiveWave may include market profile and volume profile studies. Market profile organizes trading activity by time and price, while volume profile displays the amount of volume traded at different prices. Both methods aim to show where trading activity concentrated during a selected period.
Common profile references include the point of control, value area, high-volume nodes, and low-volume nodes. Traders may use these areas to assess acceptance, rejection, balance, or directional movement. Definitions and calculation settings vary, so users should confirm how the software derives each value.
VWAP, or volume-weighted average price, measures the average traded price weighted by volume. Session VWAP is common among intraday traders, while anchored VWAP begins from a chosen event or date. Bands may be placed around VWAP using standard deviation or another measurement method.
Profile and VWAP readings depend on data quality and session configuration. A futures profile based only on regular trading hours will differ from one using the full electronic session. Cryptocurrency markets trade continuously, which requires the user to choose an artificial session boundary. That choice can materially change the display.
Order Flow and Bid-Ask Data
Order-flow analysis studies transactions at the bid and ask, traded volume at each price, cumulative delta, and related activity. MotiveWave may provide footprint-style displays, delta studies, depth information, and other order-flow features, depending on the edition and data connection.
Cumulative delta compares buying activity at the ask with selling activity at the bid. Traders often compare delta behavior with price movement to look for agreement or divergence. A rising market with weakening delta may prompt closer review, although it does not automatically signal a reversal.
Order-flow tools require suitable market records. End-of-day prices are not enough, and some feeds provide better historical bid-ask classification than others. Reconstructed records may differ from exchange-supplied transaction data. Before relying on a footprint chart or delta backtest, the user should verify what the feed actually contains.
Displayed market depth also has boundaries. Orders can be cancelled, moved, hidden, or executed through venues not represented in a chosen feed. The order book shows available information at a moment in time; it does not reveal every participant’s intention.
Watchlists, Scanners, and Alerts
Watchlists allow users to follow selected instruments and display fields such as last price, net change, percentage change, bid, ask, volume, and indicator values. Lists can be separated by market, strategy, sector, or trading session.
Scanning tools search groups of instruments for defined conditions. A scan might identify prices crossing a moving average, unusually high volume, volatility expansion, momentum readings, or breakouts from a recent range. Custom studies may also support scanning if the edition and programming framework permit it.
Scanner results should be viewed in relation to the data set being searched. A scan of several thousand stocks may require exchange coverage that a basic feed does not supply. Thinly traded securities can also appear because of large percentage changes produced by one transaction. Filters for price, volume, and liquidity can reduce such noise.
Alerts can monitor price levels, study conditions, trendline breaks, and other events. Notification choices vary by platform version and configuration. An alert may appear inside the program, play a sound, or use another supported method.
Alerts reduce the need to stare at every chart, but they require testing. Session resets, symbol changes, delayed data, and connection failures can affect whether an alert fires. Traders should also check whether a condition triggers once, once per bar, or every time the rule becomes true.
Broker Connections and Live Trading
MotiveWave can connect with supported brokers and trading services. A compatible connection may allow the user to submit orders, cancel or modify working orders, monitor positions, and view account balances from the platform.
Connection support can change. A broker listed for one asset class may not offer the same functions for another. Account type, geographic location, exchange permissions, and broker technology can all affect availability. Prospective users should confirm current compatibility with both MotiveWave and the broker before buying software or data.
Order types may include market, limit, stop, stop-limit, bracket, and conditional orders, subject to broker support. Some orders may be held at the exchange, some at the broker, and others within the local platform. That distinction matters if the computer disconnects. A locally managed stop cannot operate while the software is offline.
Chart trading allows orders to be placed or adjusted from the chart. This can be efficient because the user sees entries, stops, targets, and current price together. It can also make accidental order placement easier. Simulation provides a sensible place to learn mouse actions and confirmation settings before live use.
Execution Is Controlled Beyond the Platform
MotiveWave can transmit an order, but it cannot guarantee acceptance, liquidity, fill price, or execution speed. The broker, exchange, routing provider, internet connection, and current market conditions all affect the outcome.
Fast markets can create slippage between an expected price and an actual fill. Stop orders may execute away from their trigger level, while limit orders may remain unfilled. Partial fills can leave an unexpected position size. Traders need procedures for each case rather than assuming the chart will sort it out.
Broker backup access is necessary for live trading. Users should know how to close or modify a position through the broker’s website, mobile application, or trade desk if MotiveWave becomes unavailable. Broker contact details and account credentials should be accessible without relying on the trading computer.
Simulated Trading
Simulation allows users to practise order entry and strategy execution without committing real funds. It is useful for learning platform controls, testing workspace arrangements, and checking whether bracket orders behave as expected.
Simulated fills can differ from live fills. A simulator may assume execution when price touches an order, even though a live order would sit behind other orders in the queue. It may also treat spreads and partial fills more favourably than actual trading.
For that reason, simulation measures procedural readiness better than financial readiness. A method that works in a simulated account still needs realistic cost assumptions and cautious live validation. The absence of real order-book position makes exact replication impossible.
Strategy Development and Backtesting
MotiveWave includes strategy development and historical testing functions in applicable editions. Users can define entry and exit rules based on price, indicators, time windows, volume, or custom calculations. The platform then applies those rules to historical records and produces performance statistics.
Common measurements include net profit, maximum drawdown, average trade, win rate, profit factor, trade count, and exposure. No single statistic gives a full assessment. A high win rate can accompany poor performance if losing trades are much larger than winners. A strong net profit may also result from one unusual trade.
Backtests need realistic commissions, spreads, and slippage. These costs have a larger effect on short-term strategies that trade frequently. Futures tests must account for contract changes and rollover treatment. Stock tests may need adjustments for splits, dividends, delistings, and survivorship bias.
Bar-based testing creates another concern. If a strategy’s target and stop are both touched during one historical bar, the program needs a rule for deciding which occurred first. Lower-resolution records may not show the actual sequence. Intrabar testing or finer data can help, but it still depends on feed quality.
Overfitting and Out-of-Sample Testing
Repeatedly changing parameters until a strategy looks profitable can produce overfitting. The resulting rules may describe historical noise rather than repeatable market behavior. A test with many adjustable inputs carries greater risk because more combinations can be tried.
One defence is to reserve part of the data for out-of-sample testing. Rules are developed on one period and assessed on another period that was not used during development. Walk-forward testing can repeat this process across several segments.
Parameter stability also matters. If a strategy performs well only with a 19-period setting but fails at 18 and 20, the result may be fragile. A broader area of acceptable performance usually provides a more credible basis for further testing.
Automated Trading
Some MotiveWave editions can run automated strategies through a connected broker. An automated system monitors its conditions and may submit, modify, or cancel orders according to programmed rules.
Automation can apply rules consistently and monitor markets for long sessions. It does not remove operational risk. Bad data, duplicate orders, incorrect contract selection, connection loss, coding errors, and unexpected position states can produce rapid losses.
An automated strategy should have controls for maximum position size, daily loss, repeated entries, stale data, and connection status. The trader also needs a method for reconciling the platform’s reported position with the broker’s actual position. If the two disagree, the broker’s record governs the account.
Testing should move through stages: historical testing, simulation, monitored paper operation, and small live size. Each stage answers a different question. Historical testing assesses past rule behavior, while monitored operation tests the software, feed, broker connection, and order handling in real time.
Programming and Custom Studies
MotiveWave provides a software development framework for users who want custom indicators, scanners, signals, or strategies. Programming support is relevant to traders whose methods cannot be represented with built-in studies alone.
A custom study might combine several calculations, apply proprietary filters, create visual markers, or generate alerts. A strategy can add order rules, position sizing, and trade management logic. Developers need knowledge of programming as well as bar construction, market sessions, order states, and data handling.
Code should be documented and versioned. Platform updates, broker changes, or revised data formats can affect behavior. A study that displays correctly on a chart may still contain errors when used for scanning or automation because those functions can process records differently.
Testing custom code across instruments and sessions is also necessary. Futures contracts have expirations and tick values, forex pairs use different pip conventions, and stocks may trade through gaps. Assumptions that hold for one market can fail elsewhere.
Market Data and Historical Records
The quality of a MotiveWave setup depends heavily on its data source. Providers differ in exchange coverage, historical depth, timestamp accuracy, bid-ask classification, and adjustment methods. Two feeds can create slightly different bars from the same market.
Real-time exchange data may require separate agreements and fees. Exchanges often distinguish between non-professional and professional subscribers. The classification can materially affect monthly cost. Delayed quotes may be adequate for study but unsuitable for active execution.
Historical depth matters for long-period indicators and strategy tests. A feed may offer years of daily data but only a few months of tick records. Downloading large intraday histories can take time and storage, particularly across many futures contracts.
Missing records should not be ignored. A gap in data may create a false breakout, distorted indicator, or inaccurate trade in a backtest. Users should inspect unusual results on the chart and compare them with another source when practical.
Trading Sessions and Time Zones
Session templates define which hours contribute to chart bars and studies. This is especially relevant to futures, which may trade for most of the day but also have an exchange-defined settlement period.
A moving average calculated from regular-session bars can differ from one based on the full electronic session. Volume profile, VWAP, opening range, and daily highs or lows can also change. The trader should use session settings that match the intended method.
Time-zone settings affect bar boundaries and scheduled rules. A strategy programmed to enter at 09:30 must use the intended exchange or local time. Daylight-saving changes add another source of errors, especially when comparing markets in different countries.
Futures Contracts and Continuous Charts
Futures contracts expire, so traders periodically move from one delivery month to another. A continuous futures chart joins several contracts into a longer history. The joining method may use back adjustment, ratio adjustment, or an unadjusted series.
Each method changes the chart in a different manner. Back adjustment can alter older price levels to remove rollover gaps. An unadjusted series preserves traded prices but may show gaps that did not represent normal market movement. Indicators and test results can vary accordingly.
A continuous symbol may be useful for analysis, but orders must normally be sent to an actual contract month. Users should confirm that the chart and trading panel reference the intended contract. Sending an order to an inactive month can result in poor liquidity or a wide spread.
Options, Forex, and Cryptocurrency Use
Options support depends on the broker connection, data service, and available platform functions. Traders who require option chains, Greeks, multi-leg orders, or volatility analysis should verify each feature before adopting the software. Charting an option contract is not the same as having a complete options workflow.
Forex data can vary because the market has no single centralized exchange price. Quotes reflect the chosen broker or liquidity source. Volume may represent tick activity rather than centralized traded volume, which affects volume-based studies.
Cryptocurrency connections can differ by exchange, symbol format, available history, and trading permissions. Continuous trading also requires choices about daily session boundaries. Automated users should account for exchange maintenance, funding rules, and differences between spot and derivative contracts.
Computer and Network Requirements
Computer needs depend on workload. A few daily charts with conventional studies require far fewer resources than dozens of tick charts, order-flow displays, scanners, and automated strategies running at once.
Memory affects how comfortably the platform handles large histories and several workspaces. Processor performance matters for calculations, backtests, and real-time updates. Fast local storage can shorten startup and data-loading times. Users should check current MotiveWave requirements because operating-system support changes.
A stable wired internet connection is generally preferable for active trading. Wi-Fi can work well, but signal changes and local congestion add another failure point. Some traders keep a mobile connection available as a backup, though switching networks during an open position still requires care.
Pricing, Editions, and Total Cost
MotiveWave has offered multiple editions with different feature sets. Entry editions tend to focus on charting and standard technical analysis. Higher editions may add advanced wave tools, profile studies, strategy testing, automation, and software development access.
Edition names, licence terms, included functions, and prices can change. Buyers should compare current feature tables rather than relying on older reviews. A feature mentioned in a tutorial may belong to another edition or an earlier version.
The software licence is only one cost. A working setup may also include exchange data, broker commissions, routing charges, regulatory fees, add-on services, and computer hardware. Professional data status can make market access considerably more expensive.
| Cost category | What to check |
|---|---|
| Software licence | Edition, billing term, device rules, and included analytical functions |
| Market data | Real-time status, exchange coverage, historical depth, and subscriber classification |
| Brokerage | Commissions, routing fees, minimum balances, and supported order types |
| Hardware | Memory, processor, monitors, storage, and backup internet access |
| Development | Custom coding, maintenance, testing time, and third-party study costs |
A trial can help verify compatibility before purchase. Testing should use the intended data provider where possible. Delayed demonstration data may show the interface, but it does not fully represent live order flow, execution, or scanner performance.
Main Benefits of MotiveWave
MotiveWave’s primary benefit is analytical breadth within one desktop application. Standard charting, Elliott Wave tools, profile studies, order flow, scanning, strategy testing, and broker access can sit within the same workspace.
Customization is another practical benefit. Users can save templates, control chart appearance, arrange multiple workspaces, define alerts, and create custom studies. Traders with a settled analytical process may value that control more than users who want a ready-made interface.
The software also supports a progression from visual analysis to rule-based testing. A discretionary setup can be measured, converted into conditions, tested on historical records, and monitored with alerts. That progression can expose vague rules that looked clearer on a finished chart than they were in real time.
Constraints and Practical Concerns
The quantity of features creates a learning burden. New users must become familiar with data connections, symbol formats, workspaces, session templates, chart settings, and order controls. Advanced functions are useful only after the user knows what each setting changes.
Configuration errors can be subtle. The wrong session template may alter VWAP, the wrong futures contract may show thin trading, and an incorrect time zone may trigger a strategy at the wrong hour. These are not dramatic software failures; they are ordinary setup mistakes, which can make them harder to notice.
Dependence on external services is another concern. MotiveWave may be running correctly while a broker, exchange, or data provider has an outage. Users need to identify which connection has failed rather than restarting everything at random.
The platform also cannot replace risk controls. Technical tools describe price, volume, and order activity, but they do not remove uncertainty. Position sizing, leverage, exit rules, concentration, and account-level loss controls remain the trader’s responsibility.
Who Is MotiveWave Suited To?
MotiveWave may suit active futures traders, forex traders, technical stock traders, Elliott Wave analysts, and developers working with rule-based systems. It is particularly relevant to users who need several analytical methods and are willing to configure a desktop workstation.
It can also serve educators and market researchers who need annotated charts, saved templates, and historical testing. Custom development access may appeal to programmers who want to build studies without creating a trading platform from scratch.
The software may be more than necessary for an investor who checks a portfolio occasionally, places a few long-term trades, and uses basic valuation research. A broker’s own application may cover those tasks at lower cost and with less setup.
It may also be a poor fit if the required broker, exchange, or data provider is not supported. Compatibility should be verified early, especially for regional exchanges, complex option orders, institutional accounts, or automated execution.
How to Assess MotiveWave Before Buying
Evaluation should begin with the intended trading process. The user should identify the markets, intervals, chart types, indicators, data depth, and order functions required. This creates a practical checklist for comparing editions and connections.
During a trial, users should test chart loading, workspace saving, historical downloads, study calculations, scanner speed, and alert behavior. Live traders should examine how orders, positions, fills, and account balances appear. Strategy developers should test commission settings, intrabar handling, and exported performance records.
Broker integration deserves direct testing in simulation. Place market, limit, stop, and bracket orders. Modify them, cancel them, and check how the platform reports partial fills. Disconnect the data feed or close the program in a controlled test to learn which orders remain active.
Start with a plain workspace containing one watchlist, a few charts, and the order panel. Add profile tools, scans, and extra monitors only when they serve a defined purpose. This approach makes performance problems easier to diagnose and reduces visual clutter.
Final Assessment
MotiveWave is a feature-rich desktop platform with strong charting, Elliott Wave, market profile, order-flow, strategy testing, customization, and broker integration capabilities. It can support discretionary analysis as well as programmed trading methods, provided the chosen edition and external connections supply the required functions.
Its value depends less on the raw number of tools than on how well those tools fit the user’s process. Traders who need advanced charting and are prepared to manage data, workspaces, and software settings may find it a capable workstation. Users with basic research or occasional trading needs may find a simpler broker platform more practical.
Before committing funds, prospective users should verify current edition features, broker support, data fees, computer requirements, and order behavior. Historical tests and automated strategies also need realistic assumptions and monitored validation. MotiveWave can organize analysis and execution, but trading results still depend on the method, risk controls, data quality, and decisions made by the account holder.