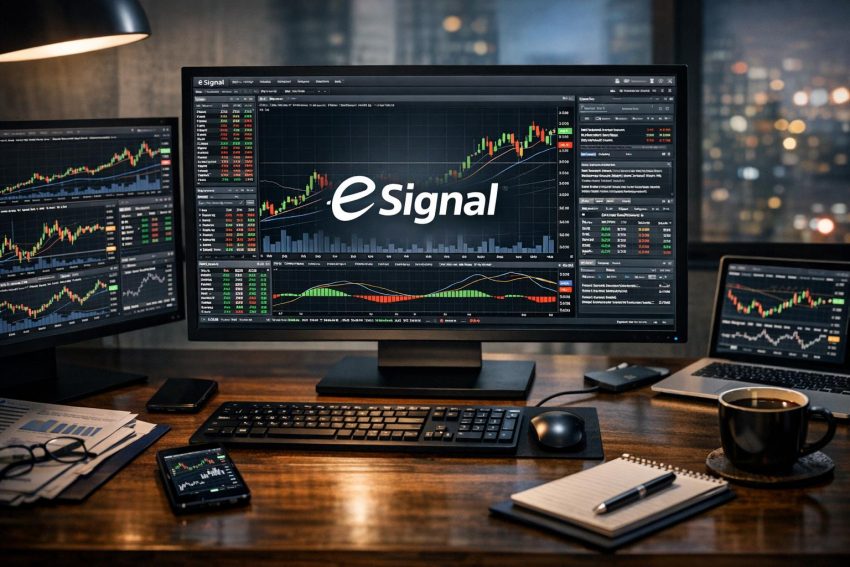
eSignal is a market-data and technical-analysis platform for active traders, investors, analysts, and financial professionals. It combines streaming quotes, historical price records, interactive charts, technical studies, alerts, market scans, news, and selected brokerage connections within one desktop environment. Several service levels are available, so users can select software features and exchange feeds that match the instruments they monitor.
The platform is best known for detailed charting and access to data from many exchanges. Depending on the plan, exchange permissions, and account classification, a user may monitor equities, listed options, futures, foreign exchange, indices, and other financial products. Active traders often use eSignal for intraday charts and live quotes, though daily and weekly records also support swing trading, portfolio research, and longer-term market analysis.
eSignal is primarily an information and analysis service rather than a standalone brokerage. Some customers connect it to a supported broker and submit orders through the platform. Others use it only for research, then place trades through a separate brokerage application. That distinction matters because quote delivery, chart calculations, order routing, and account custody may be handled by different companies.
What eSignal Does
At its core, eSignal receives financial data and presents it through configurable charts, quote windows, market screens, and analytical tools. A trader can select a symbol, choose a chart interval, apply technical indicators, draw price levels, compare related instruments, and create alerts based on chosen conditions. Depending on the subscription, the same workspace may display time and sales, market depth, news, watchlists, fundamentals, and order-entry controls.
Market information comes from exchanges and financial-data vendors. What appears on screen depends on the software plan, activated exchange packages, symbol type, session settings, and whether the feed is real-time or delayed. Two eSignal users can therefore see different quote fields or chart histories even when they follow the same instrument.
Exchange licensing also affects access. Many exchanges distinguish between professional and non-professional subscribers. A person employed by a financial firm, registered with a regulator, or using data for business purposes may face higher fees than an individual trading a personal account. The classification rules come from the exchanges, not simply from the charting provider.
A typical eSignal setup may include several connected tasks:
- Monitoring live bid, ask, last-sale, and volume data
- Reviewing intraday and historical charts
- Applying built-in or custom technical studies
- Screening groups of securities for defined conditions
- Receiving price or indicator alerts
- Following news and corporate information
- Sending orders to a compatible brokerage account
Not every customer needs all of these functions. A futures trader may care mainly about low-latency exchange data and intraday chart history. A position trader may place more value on daily charts, watchlists, and alerts. Paying for unused exchanges and analytical functions is an easy way to turn a sensible subscription into an expensive desktop ornament.
Market Data and Exchange Coverage
Multi-market coverage is one of eSignal’s central attractions. Available data may include US and international shares, listed options, futures contracts, spot foreign exchange, market indices, and selected over-the-counter instruments. Access varies by subscription and region, and an exchange may require a separate agreement before its real-time feed becomes active.
Real-Time, Delayed, and Historical Data
Real-time data reports market activity with minimal distribution delay, subject to network and processing time. Delayed data is commonly held back by 10, 15, or 20 minutes, depending on exchange policy. Historical data covers earlier sessions and may be supplied at tick, minute, daily, weekly, or monthly resolution.
Delayed quotes can support education, general observation, and some forms of end-of-day research. They are poorly suited to short-term order decisions. If a share is moving rapidly, a delayed chart may show a price that no longer reflects the tradable market. A trader should verify the status of each exchange feed rather than assume that every green or red number is live.
Historical availability also differs by interval. A platform may offer many years of daily bars but a shorter record of tick or one-minute data. Intraday files are much larger and require more storage and processing. Anyone testing an intraday method should confirm the earliest date available, how session breaks are handled, and whether old records have been corrected after exchange revisions.
Consolidated and Venue-Level Quotes
Equity data may represent a consolidated feed containing trades or quotations from several venues. Other fields may relate to one exchange or reporting facility. This distinction affects bid and ask displays, volume totals, and the apparent timing of trades.
A venue-level quote does not always show the best available price across the full market. Likewise, a last-sale field records a completed transaction, while the bid and ask show displayed buying and selling interest. These fields answer different questions. The last price indicates where a trade occurred; the quote indicates where participants are currently advertising interest.
Futures Contracts and Continuous Symbols
Futures data requires careful symbol selection. Each contract has a delivery month and expiration cycle. A crude oil contract expiring in one month is a different instrument from the contract expiring later, even if both refer to the same underlying commodity.
Continuous futures symbols combine records from successive contracts to form a longer chart. They are useful for studying trends, seasonality, and prior price behavior. They are not normally tradable instruments. The price shown on a continuous series may differ from the active contract because the chart switches between expirations or adjusts earlier records to reduce rollover gaps.
Before sending a futures order, users should confirm:
- The exchange and contract month
- The expiration and first-notice dates
- The minimum price movement, commonly called the tick
- The monetary value of one tick or point
- The regular and electronic trading sessions
- The broker’s symbol format
A symbol mismatch can result in a rejected order or, worse, an accepted order in the wrong contract. That is not the sort of platform lesson anyone wants to pay for.
Options Data
Options analysis may require more than basic bid and ask quotes. Traders may need strike prices, expiration dates, open interest, contract volume, implied volatility, and sensitivity measures such as delta or theta. Availability varies by package and data source.
Option contracts can have wide spreads and infrequent trades. A last price from earlier in the session may have little connection to the current market. Reviewing the present bid, ask, underlying price, and trade timestamp provides a more accurate reading than relying on last sale alone.
Charting Features
Charting is a central part of eSignal. Users can build charts for individual instruments and configure the interval, session, price display, colors, indicators, and annotations. Common formats include candlesticks, open-high-low-close bars, line charts, and area charts. Other chart styles may be available according to the platform version and installed studies.
Intervals and Historical Views
Chart intervals may range from tick-based displays to intraday bars, daily records, weekly bars, and monthly data. A one-minute chart groups activity into one-minute periods, while a tick chart creates a new bar after a selected number of transactions or updates. These formats can produce quite different visual results from the same stream of market activity.
Short intervals show more detail but also contain more market noise. A one-minute chart may help with entry timing, while a daily chart provides better context for a multiweek trend. Many traders keep more than one interval open so that an entry does not conflict with the broader price structure.
The amount of visible history depends on the instrument, interval, subscription, and server records. Loading very long intraday histories can consume memory and slow calculations, especially if several indicator-heavy charts are open at once.
Drawing and Annotation Tools
Users can place trend lines, horizontal price levels, channels, Fibonacci measurements, text notes, and other drawings on charts. These tools can mark support, resistance, prior highs, gaps, planned entries, and risk levels.
Annotations are most useful when they support a repeatable process. Filling a chart with every possible line tends to hide current price behavior. A cleaner approach is to mark levels that affect an actual decision and remove old drawings once they no longer apply.
Templates allow users to save chart appearance and indicator settings for later use. A swing-trading template might contain daily candlesticks, two moving averages, volume, and an average true range study. An intraday futures template could use several timeframes with session-based volume and short-period momentum measures.
Multiple Charts and Linked Windows
A workspace can contain several charts arranged across one or more monitors. A stock trader might view an individual share beside its sector fund, a broad equity index, and an index futures contract. A currency trader may compare several related pairs to see whether movement comes from one currency or from a broader change in risk appetite.
Linked windows can update together when the selected symbol changes. This is helpful during watchlist review because the user does not need to type the same ticker into every panel. Charts can be assigned different intervals while retaining the common symbol, providing short-, medium-, and longer-range views side by side.
Technical Indicators and Studies
eSignal supports many established technical-analysis studies. Common examples include simple and exponential moving averages, Bollinger Bands, relative strength index, moving average convergence divergence, stochastic oscillators, average true range, average directional index, pivot calculations, and volume-based measures.
Technical indicators are formulas based on price, volume, open interest, or related data. They organize past and present observations; they do not know what the next bar will do. A moving average can describe trend direction, and average true range can estimate recent price movement, but neither provides a guarantee of a profitable trade.
| Study type | Common purpose | Practical caution |
|---|---|---|
| Moving averages | Identify direction and smooth short-term price movement | They react after price changes and may lag during reversals |
| Momentum oscillators | Measure the speed or persistence of recent movement | Overbought readings do not automatically mean price will fall |
| Volatility studies | Estimate the recent range or dispersion of prices | Past volatility may change quickly after news or market shocks |
| Volume studies | Compare price movement with trading activity | Volume definitions vary by asset class and feed |
| Trend-strength measures | Assess whether directional movement is weak or strong | They may not identify direction without another input |
Most studies allow changes to the calculation period, price source, color, line style, and panel location. A moving average might use closing prices over 20 bars, while another version uses typical price over 50 bars. Small setting changes can alter historical signals, so parameters should be recorded when a method is tested.
Using many indicators does not necessarily improve analysis. Several momentum studies often restate similar price behavior in slightly different forms. A chart with five correlated oscillators can create an illusion of confirmation even though all five are reacting to the same recent move.
Custom Studies and Scripting
Advanced users may develop custom indicators or rule-based studies with eSignal’s scripting tools. A script can calculate a proprietary measure, display chart markers, trigger an alert, or combine several conditions into one output. This permits analysis that goes beyond the standard study library.
Custom code needs careful testing. A formula may behave differently on an unfinished intraday bar than on a completed historical bar. Some calculations can appear accurate in hindsight because they use data that was not yet final at the time of the signal. Traders should check whether a study recalculates past values, references future bars, or changes after a session closes.
Version changes may also affect old scripts. Keeping copies of source files, parameter notes, and working platform versions makes recovery easier after a computer replacement or software update.
Alerts and Market Monitoring
Alerts allow users to follow price conditions without staring at every chart. A notification may be triggered when price reaches a chosen level, percentage change exceeds a threshold, volume increases, or a technical study meets a defined rule.
Simple price alerts are usually easier to verify than multi-condition alerts. A user might request a notification when a stock trades above a prior high or below a planned exit level. An indicator alert could monitor a moving-average crossover, an oscillator threshold, or a volatility change.
The exact trigger logic deserves attention. An alert based on last price may behave differently from one based on bid, ask, or bar close. A crossover detected during an unfinished bar may disappear before that bar closes. Users should know whether the platform evaluates conditions continuously, once per update, or only after a bar is complete.
An alert is not an order and should not replace account risk controls. Price can move through an alert level before a trader reacts. During fast trading, the available execution price may be far from the notification price. Network outages, sleeping computers, platform restarts, and expired login sessions can also interrupt alert delivery.
Market Scanning
Scanning tools search a group of instruments for selected conditions. A scan may identify shares with unusual volume, securities trading above a moving average, contracts near a recent high, or symbols meeting a price-and-volatility rule. This reduces the manual work involved in reviewing a large watchlist.
Scan quality depends heavily on the chosen universe. A broad equity scan may return thinly traded shares, securities with wide spreads, or instruments that cannot be traded through the user’s broker. Applying practical filters for price, average volume, exchange, sector, and market value can produce a more usable set of results.
Criteria should not be so narrow that they describe only a perfect historical setup. A scan with too many conditions may return very few candidates and encourage users to loosen rules whenever they feel short of ideas. That habit turns a screening process into a moving target.
Intraday Volume Scans
Intraday volume requires time-aware comparison. Trading activity is often highest near the open and close, so volume at 9:45 a.m. should not be compared directly with an ordinary full-session average. A better measure compares current activity with the amount normally recorded by the same time of day.
News, earnings reports, index rebalancing, contract expiration, and market-wide volatility can all create unusual volume. The scan identifies the statistical condition; it does not explain the reason. Traders should review news and price behavior before treating volume as a trade signal.
Quotes, News, and Fundamental Information
Quote windows can display fields such as last price, net change, percentage change, bid, ask, high, low, open, previous close, and volume. Users can arrange columns to create compact watchlists or broader monitoring screens.
Field definitions matter. Daily change may be measured from the previous official close, while an extended-hours move may compare against another reference point. Volume may include or exclude off-exchange transactions depending on the feed. Timestamps should also be checked when a security trades infrequently.
News coverage may include company announcements, economic reports, analyst commentary, and general market reporting. Availability depends on the subscribed news sources. A headline can alert the user to an event, but it may omit context or report preliminary details. Material decisions should be checked against company filings, exchange notices, central-bank releases, or other primary records.
Where available, fundamental fields may include earnings, dividends, valuation ratios, company descriptions, and financial statement figures. Providers do not always calculate these fields in the same manner. Trailing earnings, forward estimates, adjusted earnings, and generally accepted accounting figures can produce different ratios for the same company.
Dates are equally relevant. A balance-sheet figure may come from the latest quarterly report, while a valuation ratio uses a newer market price. Comparing companies without checking reporting periods can create misleading impressions.
Broker Connections and Order Entry
Some users connect eSignal with a compatible brokerage account. Depending on the integration, orders may be entered from a chart, quote window, or trading panel. The platform may also display working orders, fills, positions, and account figures received from the broker.
Broker compatibility can change by region, account type, asset class, and software version. A broker listed as supported for equities may not support futures or options through the same connection. Prospective users should confirm current compatibility with both eSignal and the brokerage before funding an account for this purpose.
Symbol Mapping
The symbol used for chart data may not match the broker’s order symbol. Futures, options, and foreign exchange products are especially prone to differences in exchange codes, month identifiers, strike formats, and currency notation.
Symbol mapping should be tested in a simulation account where available. Users can compare the contract description, exchange, expiration, and multiplier before placing a live order. The order ticket should always be read in full rather than treated as a final click-through screen.
Order Types and Status
Common order types include market, limit, stop, and stop-limit orders. Availability depends on the broker, exchange, and instrument. Time-in-force choices may include day, good-till-canceled, immediate-or-cancel, or other exchange-supported instructions.
The broker or exchange generally holds and manages accepted orders, though the arrangement can vary. An order drawn on a chart may only be a visual representation of information received from the broker. If the platform disconnects, the display can become stale even while the broker continues processing the order.
After submitting an order, traders should verify its status through the broker’s official records. A transmitted order is not necessarily accepted, and an accepted order is not necessarily filled. Partial fills, rejections, cancellations, and routing delays all require attention.
Workspaces and Platform Customization
Workspaces save groups of charts, quote tables, scanners, news panels, and trading controls. Separate workspaces can be created for different tasks. A futures trader may keep one layout for the morning index session and another for energy contracts. A longer-term investor may use daily charts, sector comparisons, and company data.
A practical workspace gives visual priority to information that affects decisions. Too many flashing quotes and overlapping windows increase computer load and make relevant changes harder to notice. More screen space does not automatically produce better analysis.
Window linking, saved templates, color settings, and hotkeys can reduce repetitive actions. Consistent colors also help. If red means a falling price in one panel and a buy signal in another, interpretation becomes slower than it needs to be.
Backups and Record Keeping
Templates, scripts, alert settings, and watchlists may be stored locally or associated with the account, depending on the feature. Users should identify where each file resides and keep backup copies of work they cannot easily rebuild.
A short written record of indicator periods, session times, scan rules, and data packages can be surprisingly useful after a hardware failure. Memory is less dependable than traders tend to believe, especially six months later.
Data Quality and Technical Performance
Market-data quality depends on exchange permissions, internet performance, computer resources, symbol settings, and the way records are normalized. Before relying on a chart, users should check for missing bars, unexplained gaps, incorrect session times, unusual volume readings, and stale quotes.
Two reputable feeds may show small differences because they process corrections, off-exchange reports, timestamps, or extended-hours trades differently. Minor discrepancies do not always indicate an error. Larger differences should be compared with exchange records or raised with the data provider.
Session Templates
Session settings determine which hours appear on a chart. An equity chart may include only the regular session or may also show premarket and after-hours trading. A futures chart may display nearly continuous electronic trading or a shorter pit-style session.
Changing the session alters highs, lows, gaps, volume totals, moving averages, pivots, and other calculations. A strategy tested with regular-session data should not be traded from an extended-hours chart without being tested again under the new settings.
Hardware and Internet Requirements
Real-time charts, scans, scripts, and quote windows consume memory and processor capacity. Performance can slow when many symbols update at once, especially during the opening minutes or after major economic news. Users should compare their computer with the provider’s current system requirements and allow room for heavier workloads.
A stable wired internet connection may offer more consistent performance than congested wireless service. Traders who rely on live order entry should also have a backup method for contacting the broker, such as a mobile application or telephone desk.
Historical Testing and Strategy Research
eSignal can support historical analysis and rule-based study development. A trader may test how a method behaved across different instruments, time periods, and volatility conditions. The purpose is not to produce an impressive equity curve; it is to examine whether the trading rule remains plausible after realistic costs and execution assumptions are applied.
Historical tests can contain survivorship bias, missing records, incorrect corporate-action adjustments, and unrealistic fills. A strategy tested only on companies that remain listed today ignores failed or delisted firms. Equity charts also need proper treatment of splits and dividends, depending on the research goal.
Intraday testing requires assumptions for bid-ask spreads, commissions, slippage, latency, partial fills, and available volume. Entering every trade at the exact historical close of a bar is often unrealistic because the closing value was not known until that bar ended.
Parameter Fitting
Repeatedly changing settings until a strategy performs well on one sample can fit random past behavior. A better research process separates development records from evaluation records. The method can then be checked on later periods, other instruments, and different volatility regimes.
Small parameter changes should not destroy a sound idea. If a strategy works with a 19-period average but fails completely with 18 or 20 periods, the historical result may be fragile. Paper trading or simulation can provide another test before capital is placed at risk.
Pricing and Subscription Costs
eSignal pricing depends on the software package, exchange feeds, news products, and subscriber classification. Fees can change, so customers should use the provider’s current order pages and exchange schedules rather than an old review or forum post.
The advertised platform price may not represent the full monthly bill. Real-time exchanges are often charged separately, and professional data status can raise those charges. Optional news services or premium data packages may add further costs.
Before subscribing, users should list every symbol they plan to follow and identify the exchange responsible for each one. This helps prevent paying for feeds that are not needed or missing a required venue after installation.
Trial access should also be checked carefully. A trial may use delayed quotes, a smaller historical database, or different exchange permissions from a paid account. Testing only generic sample symbols says little about how the service will perform with the contracts and trading hours the customer actually uses.
Advantages and Restrictions
eSignal’s strengths include detailed charting, multi-market data access, configurable workspaces, technical studies, scanning, and broker connections. It may suit active traders who need more analytical control than a basic brokerage chart provides. Cross-market access is also useful for comparing related instruments, such as an equity index, its futures contract, sector funds, and constituent shares.
The platform may be excessive for someone who checks a portfolio once a week or needs only end-of-day prices. Data subscriptions can make the monthly cost higher than simpler charting services. The range of settings also creates a learning period, particularly for users dealing with futures symbols, exchange permissions, scripts, or broker mapping.
Desktop performance is another consideration. A heavily populated workspace can consume substantial resources. Users running older hardware may need to reduce chart history, close unused panels, or avoid running several scans at once.
How to Assess eSignal Before Committing
A useful assessment starts with written requirements rather than a feature list. An equity day trader may need real-time consolidated quotes, extended-hours charts, time and sales, alerts, and intraday scans. A futures trader may focus on direct exchange feeds, contract rollover handling, session controls, and broker connectivity. An options trader may need complete chains, volatility fields, and reliable contract symbols.
During a trial or early subscription period, users should test the instruments they plan to trade. Quotes can be compared with broker data, chart history can be checked across several intervals, and alerts can be left running during active sessions. Scans should be tested at both the open and quieter times of day.
Broker integration should be tested without live exposure where simulation is available. The user can inspect symbol mapping, order types, bracket behavior, cancellation procedures, and status updates. It is also worth closing and reopening the platform to see whether layouts, alerts, and order displays return as expected.
Support quality matters most when something is not working. Users may wish to review service hours, contact methods, documentation, cancellation terms, and procedures for reporting bad data. Exchange-data questions and brokerage-order questions may go to different support teams.
eSignal can provide a capable environment for chart-based research, market monitoring, and supported order entry. Its practical value depends on receiving the right data, configuring sessions and symbols correctly, and using analytical tools within a disciplined trading process. The platform supplies information and operational tools; trade selection, execution checks, and risk control remain the user’s responsibility.